

In a nutshell
Lebanon held a revealed comparative advantage in 203 products in 2022, down from 216 in 2018. Products that lost this status had been worth $290 million, but a stable total of about $3 billion kept the decline out of view.
About 35 percent of competitive export value comes from precious stones and metals, which rest largely on imported material, and from waste and scrap. Trade data cannot show how much of this value is added in Lebanon.
Support should go to products that combine domestic value added, transferable capabilities, commercially viable firms and growing foreign demand, not simply to those near the comparative-advantage threshold. Incentives under Investment Law 360 should be linked to export performance and domestic value added.
Lebanon’s trade debate focuses mostly on how much the country sells abroad: export values, the trade deficit and market access. These indicators tell us how much Lebanon exports. They do not tell us how many products it can still make and sell competitively. In this column, we use revealed comparative advantage to examine that second question.
A country has a revealed comparative advantage (RCA) in a product when that product makes up a larger share of its exports than of world trade. The measure is easy to compute from customs data, but it has limits that matter for what follows. It is relative: a product’s score can fall because its exports decline, because other Lebanese exports grow faster, or because world trade in that product expands. A falling score is consistent with firms closing, but it does not prove it. Nor does RCA show how much of an export’s value is added in Lebanon. Throughout, we distinguish between what the trade statistics establish and what requires further evidence.
A stable total, a narrower base
In 2018, Lebanon exported 948 goods and held a comparative advantage in 216 of them. By 2022, it exported 936 goods and held a comparative advantage in 203 of them. Across broad sectors, it lost comparative advantage in nine and gained it in four. Yet the value of its competitive products barely moved. It stayed close to $3 billion, about 87 percent of total exports (Atallah and Zoughaib, 2023), because gains in plastics and rubber ($177 million) and metals ($46 million) offset declines in chemicals and foodstuffs.
Although the aggregate value of competitive exports remained stable, Lebanon’s competitive export base narrowed. Atallah and Zoughaib (2023) report that newly exported products were worth only $11 million combined, 70 percent of which came from aluminum powder and oil cakes. Products that dropped out of the export basket were worth $69 million and included lead products, live sheep and goats, antiques and cement. More significantly, products that lost their comparative advantage accounted for $290 million in exports. Trade statistics alone cannot determine whether these changes reflect firm closures, weaker sales or shifts in world trade. Where they reflect closures, however, they will be difficult to reverse: workers move on, buyers find other suppliers and certifications lapse. With bank credit largely unavailable since the 2019 crisis, rebuilding these links would be especially costly.
What sits behind the $3 billion
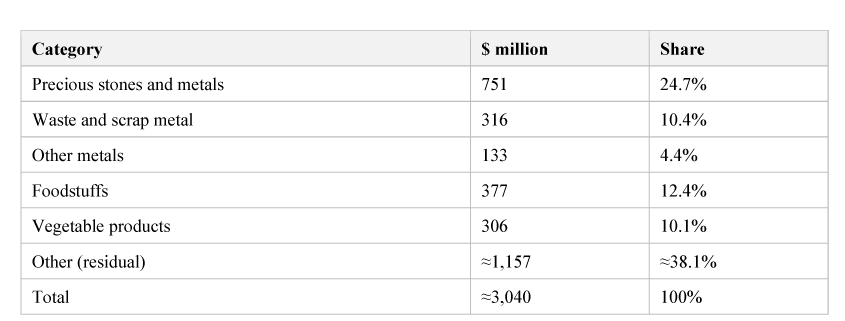
Precious metals are the largest category: five products worth $751 million, or 24.7 percent of competitive export value, led by diamonds ($436 million), jewelry ($116 million) and gold ($105 million). Lebanon has no diamond or gold mines, so this trade rests on imported stones and metal. Some of that material is likely cut, set or crafted into jewelry in Lebanon, which adds local value, but the trade data cannot show how large that domestic share is, and the sources used here provide no comparable estimates of the imported-input share, the number of active workshops or the employment behind these flows. The 24.7 percent figure measures the weight of this trade in Lebanon’s exports, not the size of the production base behind it.
Metals come second at $449 million, of which $316 million is recovered material: iron and steel scrap ($147 million), copper waste and scrap ($115 million), and aluminum waste and unwrought lead ($54 million). Scrap comes from end-of-life vehicles and appliances, demolition and industrial offcuts, and it responds to world metal prices. It can also rise when firms dismantle equipment and buildings for their materials. The trade statistics do not distinguish between these sources, so scrap exports alone do not show that productive assets are being liquidated. Given the length of Lebanon’s crisis, however, the possibility warrants monitoring.
Together, precious metals and scrap account for about $1.07 billion, or 35 percent of competitive export value. Neither can be assumed to reflect a broad manufacturing base, although both may involve some domestic activity. The products more clearly tied to domestic production are smaller: foodstuffs ($377 million), such as water, wine, sauces, nuts and baked goods, and vegetable products ($306 million), such as apples, grapes, potatoes and apricots. These are relatively simple goods, which limits the paths into more sophisticated exports.
Table 1: Composition of Lebanon’s competitive exports, 2022 ($ million)
Few complex exports, few paths upward
Complex products require more know-how to make and tend to support higher wages and more skilled jobs. Here, “complex” follows the Product Complexity Index (PCI) of the Observatory of Economic Complexity (OEC), which infers a product’s knowledge intensity from the knowledge intensity of the countries that export it. Atallah and Zoughaib (2023) classify products with a PCI above 1, on a scale of roughly −2.5 to 2.5, as complex. When their study was prepared, 2021 was the latest year of OEC data available. In 2021, Lebanon exported 88 complex products worth $151 million (excluding those below $100,000), but held a comparative advantage in only 11, worth $39 million. The largest were self-adhesive plastics ($10.6 million), paper machinery ($8.7 million), lifting machinery ($8.4 million) and papermaking machines ($3.2 million).
Countries tend to diversify into products that require capabilities similar to those they already have (Hidalgo et al., 2007). Using the OEC’s diversification frontier, Atallah and Zoughaib (2023) find that the products closest to Lebanon’s current basket are themselves of low complexity. Losing complex exports may narrow the paths upward further, although trade data cannot show whether the underlying capabilities have also been lost.
Investment frameworks not aimed at production
There is little sign that new productive capacity is emerging alongside these losses. Investment has long favored buildings over production. The Ministry of Economy and Trade ranks construction and real estate first among sectors receiving foreign direct investment, at 41 percent, and IDAL data indicate that close to half of greenfield project value went to real estate (Fakih, forthcoming). Manufacturing value added is roughly 10 percent of GDP.
Lebanon does not lack investment institutions; the problem is what they reward. Under Investment Law 360 of 2001, the Investment Development Authority of Lebanon (IDAL) can grant eligible projects exemptions of up to 100 percent from corporate income and dividend taxes for up to ten years, along with work permits. Eligible sectors range from industry and agriculture to tourism, technology and media (IDAL, n.d.-a). IDAL also lists the Agri Plus program for eligible agricultural exporters, but the public results available on its website stop at 2018; its M.LEB maritime subsidy, introduced in 2015 after land-route disruptions, ended in 2018 (IDAL, n.d.-b). Kafalat offers loan guarantees for small and medium-sized enterprises in industry, agriculture, tourism, high technology and crafts, but the guarantee still depends on a commercial bank making the loan, sharply limiting its reach while bank credit remains scarce (Kafalat, n.d.). Law 360 itself has three main shortcomings. First, eligibility rests on investment size, job creation, sector and location, not on export performance or domestic value added. Second, the eligible sectors are broad and do not appear to have been benchmarked against Lebanon’s comparative advantage. Third, Law 360 is an incentives framework rather than a comprehensive investment code: rules on foreign ownership remain spread across separate instruments, and coordination between IDAL and the line ministries is limited.
The crisis compounds these weaknesses. With deposits frozen and credit largely unavailable, firms struggle to finance equipment and working capital, and skilled workers and managers continue to emigrate.
Policy priorities
Export policy should start from a clearer picture of what Lebanon actually produces. We see four priorities.
- Separate domestic production from re-exports. Customs records on temporary admission and re-export declarations offer a starting point. Firm surveys or input–output tables can then estimate how much of each export’s value is generated in Lebanon.
- Monitor scrap exports. Source declarations at the point of export, or periodic surveys of scrap dealers, would show whether the $316 million reflects routine recycling or the dismantling of productive assets.
- Use the threshold to examine products, not to select them. Products whose RCA scores sit just above 1 are the most likely to fall below the comparative-advantage threshold. Separately, among the 11 complex products in which Lebanon retained an RCA above 1 in 2021, seven had PCI scores below 1.2 and together accounted for $15.9 million, based on our calculation using the product-level data reported by Atallah and Zoughaib (2023). An annual watchlist published alongside the trade statistics would show where competitiveness is slipping. But proximity to the threshold is a reason to examine a product, not grounds to support it. Support should go to products that generate meaningful domestic value added, draw on capabilities that carry over to related products, are made by commercially viable firms and face growing foreign demand. These criteria can be assessed using the value-added estimates above, firm-level financial data and export-potential estimates such as the International Trade Centre’s Export Potential Map (International Trade Centre, n.d.).
- Align investment incentives with export capacity. This can begin within existing institutions. It requires IDAL and the relevant ministries to share data, review the eligibility criteria under Law 360 in light of this evidence, and link incentives to measurable export performance and domestic value added rather than investment size alone.
Conclusion
The value of Lebanon’s competitive exports held steady between 2018 and 2022, which kept a narrowing base out of view. More than a third of that value rests on precious metals, built largely on imported material, and on scrap. The data establish that Lebanon has a comparative advantage in these products, not how much of their value is produced domestically. A policy built on the RCA list alone could end up favoring jewelry trading and scrap exports. The better question is which parts of the $3 billion depend on capabilities Lebanon still has, and what it will take to keep them.
Further reading
Atallah, S., & Zoughaib, S. (2023). Unpacking Lebanon’s trade amid the crisis. The Policy Initiative and Friedrich Naumann Foundation for Freedom. https://www.freiheit.org/sites/default/files/2024-04/2023_tpi-fnf-report_compressed.pdf
Fakih, A. (forthcoming). The impact of trade and investment policies on productive and decent work: Country report for Lebanon. International Labour Organization.
Hidalgo, C. A., Klinger, B., Barabási, A.-L., & Hausmann, R. (2007). The product space conditions the development of nations. Science, 317(5837), 482–487. https://doi.org/10.1126/science.1144581
Investment Development Authority of Lebanon. (n.d.-a). Incentives granted by IDAL. https://investinlebanon.gov.lb/en/doing_business/investment_incentives/incentives_granted_by_idal
Investment Development Authority of Lebanon. (n.d.-b). Export overview. https://investinlebanon.gov.lb/en/export/overview
International Trade Centre. (n.d.). Export Potential Map. https://exportpotential.intracen.org/
Kafalat S.A.L. (n.d.). What is Kafalat. https://kafalat.com.lb/title-pages/60
Observatory of Economic Complexity. (n.d.). Lebanon country profile. https://oec.world/en/profile/country/lbn