

In a nutshell
New input-output-based measures of participation in global value chains (GVCs) over the three decades from 1995 show that on average, MENA and SSA gross exports have a low content of imported intermediates.
Despite regional trade agreements that are focused on reducing barriers to intra-regional trade, regional value chains have failed to develop within the two regions – a distinctive pattern in a world of rising geopolitical tensions and increased reshoring.
For both regions, higher mobile subscriptions and higher scores on political stability are associated with higher rates of participation in global value chains; higher trade costs are associated with lower backward participation and lower overall participation.
The importance of supply chain trade in the process of structural transformation cannot be over-emphasised. Countries that participate in a supply chain can enter niches along the chain without having to build the whole product through vertical specialisation, as they had to do in the past. Thus, strong participation in global value chains (GVCs) has become an objective of countries in the Middle East and North Africa (MENA) and it is at the heart of the ‘Africa we want’ described in the African Union’s Agenda 2063.
In a recent paper, we assess how much production processes have been globalised in MENA and sub-Saharan Africa (SSA) relative to other regions; whether this process has taken place with partners within or outside the region; and whether it has taken place towards manufacturing or towards services.
Digitalisation challenges for MENA and SSA
Nowadays, around two-thirds of world trade is in intermediates with about half of world trade categorised as GVC trade in recognition that an increasing share of a country’s exports flows through at least two borders before reaching the final consumer.
As intermediate consumption increasingly originates from elsewhere, gross exports from customs data increasingly overstate the value added generated within countries, painting a distorted contribution of trade to a country’s overall economic performance. A country’s value added in exports, an important indicator of industrialisation, can be obtained by combining customs data information with interlinked national input-output tables to construct world input-output tables.
We contrast the participation of MENA and SSA in GVCs over the last quarter century (1995-2022) using measures of participation comparable across countries and sectors over time.
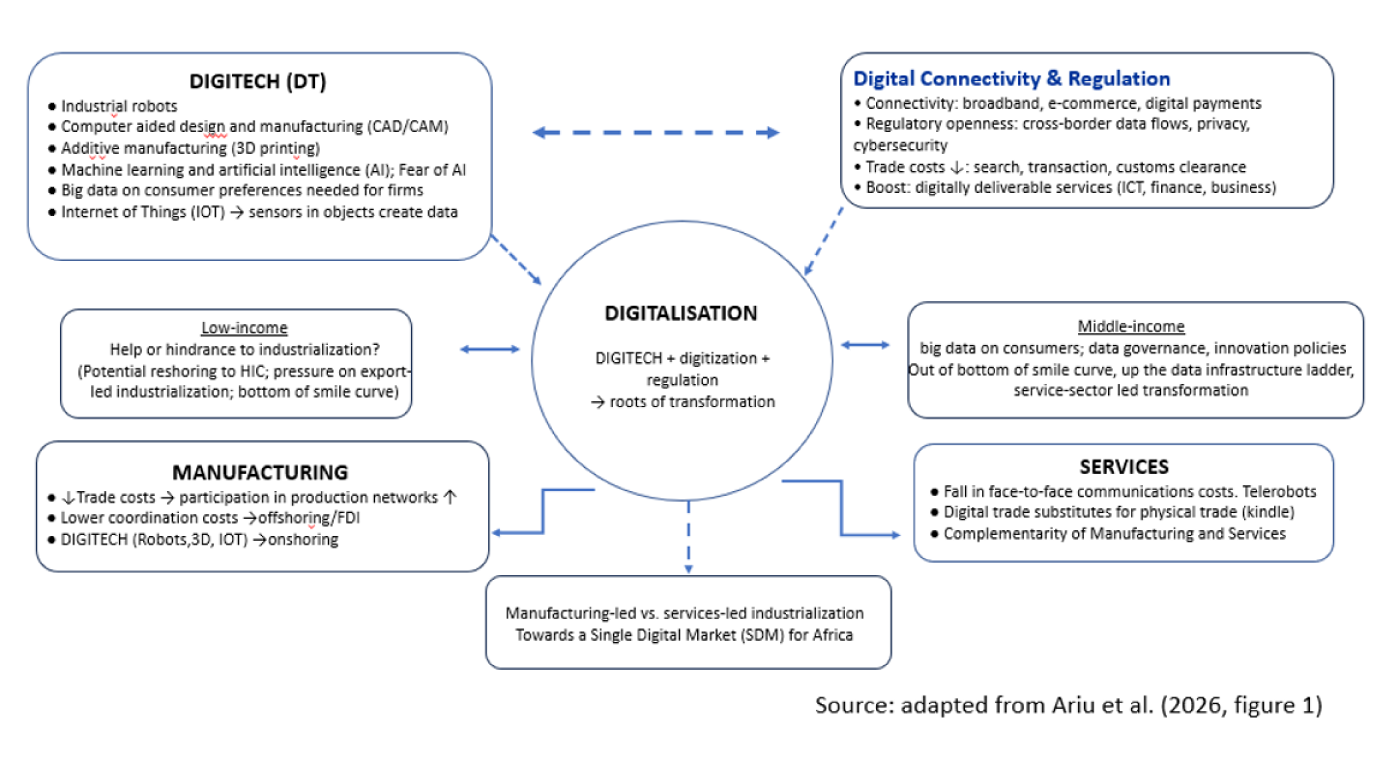
Figure 1 helps to identify the challenges that digitalisation poses for transformation in MENA and SSA. For both regions, successful digitalisation –the combination of technologies such as big data, cloud computing, artificial intelligence (AI), robotics and 3D printing with applications – must ultimately take place in both manufacturing (Industry 4.0) and consumer services (e-commerce platforms). Given the constraints of limited digital readiness and high trade costs, digitalisation is likely to take place at different speeds across countries and across the manufacturing and services sectors.
For the low-income countries of SSA on the left-hand side of Figure 1, the greatest challenge is addressing employment risks from automation. Avoiding being stuck at the bottom of the ‘smile curve’ describing the distribution of value-added generation along a supply chain is also a source of preoccupation.
The smile curve highlights the distribution of value creation across the segments in a supply chain. Its U-shape indicates that value addition is concentrated at the beginning (design, research and development – R&D) and end (marketing, services) of the chain. In terms of the international distribution of value-added, developing countries fear that they will lack the capacity to digitalise sufficiently rapidly, and so will be stuck in the production stage where value creation is lowest.
For SSA, which is projected to account for half of the growth in the world’s labour force over the 21st century, the digital economy remains small, capital is costly and internet access is limited. Automation threatens to reduce job opportunities, undermining the region’s demographic dividend.
Furthermore, digitalisation could encourage reshoring by developed countries a fear reflected in the strong perception that AI will be harmful for the next 20 years. For example, the percentage of the population that takes that view is 43% in SSA, 38% in LAC, 34% in MENA, 28% in EU and 16% in East Asia (Sucker and Banga, 2026, Figure 1).
For the MENA countries (better situated on the right-hand side of Figure 1) that have failed to develop manufacturing activities despite their relative proximity to Europe, digitalisation presents an opportunity to achieve a services sector-led structural transformation as they are better prepared to take advantage of the opportunities for services offered by digitalisation. Digitalisation offers a chance to bypass manufacturing and leverage services for structural transformation, but competitiveness and human capital weaknesses remain obstacles.
Figure 1: Channels of Digitalisation
MENA and SSA have failed to develop regional supply chains
Comparing GVC performance across countries is difficult because of limited data that can be used for that purpose. Firm-level data are not comparable across countries, nor do the data provide information on the countries of origin and destination when firms engage in international trade.
In our study, we construct comparable measures of GVCs over a long period covering 25 years in MENA and SSA using customs data that give the location of final production, its destination and final value, but not the domestic value contained in exports.
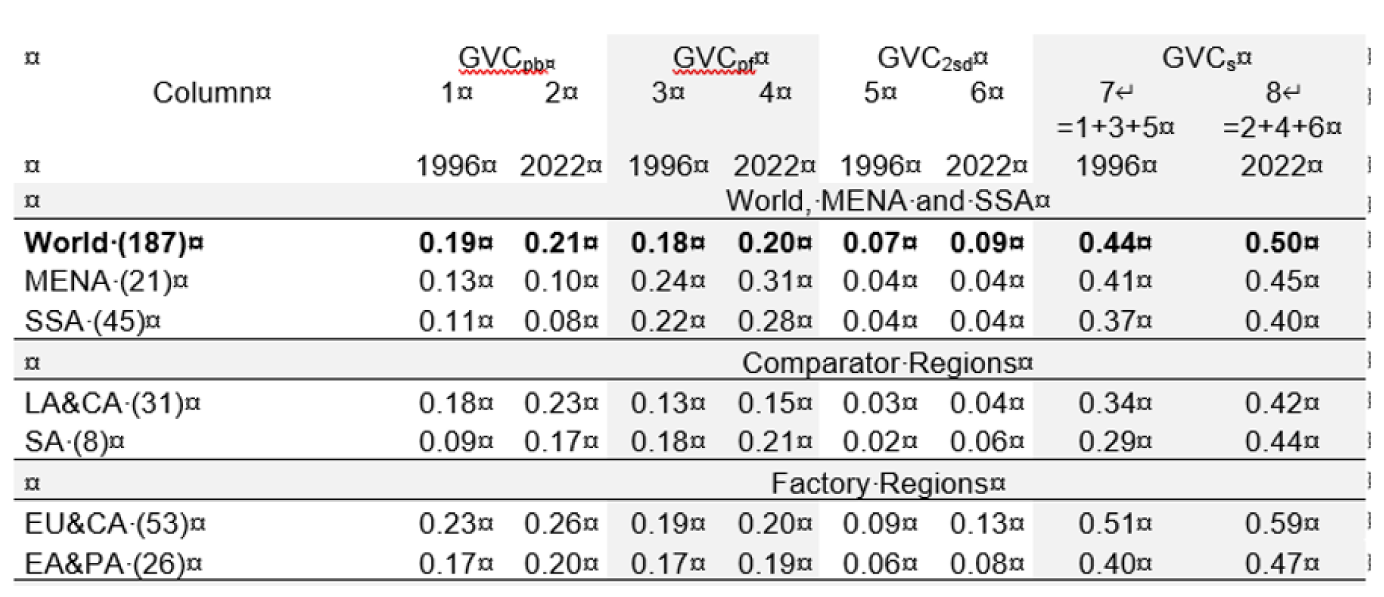
With this approach, participation in production networks is reflected in an increasing content of imported intermediates in gross exports (backward participation in GVC terminology or GVCpb in Table 1) and of exports undergoing further elaboration in destination countries before reaching the consumer (forward participation or GVCpf in Table 1).
A third component, GVC2sd in Table 1, captures the indirect contribution of activities that are suppliers to GVC activities without being directly engaged in value chain activities. Unlike indicators relying on firm-level data, these measures are comparable across countries, sectors and regions.
Table 1 displays the evolution of average participation in GVC trade in 1996 and 2022 across six regions using the three measures described above.
All regions are very heterogeneous, which means that it is difficult to make meaningful comparisons across regions. Latin America and Caribbean (LA&CA) and South Asia (SA) are low-income. They are selected as comparator regions.
Two regions with large shares of intra-regional trade intermediates – Europe and Central Asia (EA&CA) and East Asia and Pacific (EA&PA) – are categorised as ‘factory regions’ because they are highly integrated. They are included as a far-off aspiration for Africa under a ‘full’ implementation of the African continental free trade area (AfCFTA).
Four patterns from cross-country comparisons
The overall share of GVC trade grew at about the same pace as the world average for MENA and SSA, but both regions failed to increase the share of imported intermediates in gross exports
The comparator regions, LA&CA and SA, are also at the start of supply chains, but in contrast with MENA and SSA, they also increased the share of imports in their exports over the period. This pattern is consistent with high trade barriers, natural and policy-imposed, falling less rapidly than in other regions.
Table 1: GVC participation trends 1996-2022
Source: Melo and Solleder (2026, Table 1)
Measures of GVC participation should isolate the indirect content of imports, especially for factory economies
Ignoring the indirect contribution of activities that are suppliers to GVC activities without being directly engaged in value chain activities overstates the forward share (for example, by 13% to 33% for EU&CA and by 8% to 27% for EA&PA). Still, for the less integrated MENA and SSA regions, the usual decomposition would show a 28% and 26% forward share in 2022.
Regional supply chains have failed to take off in MENA and SSA
Table 2 reports supply chain indices that distinguish between intra-regional and extra-regional trade. Trade flows between countries in the same region are reported as a regional value chain (RVC) trade flow. Trade flows between a country in a region (for example, Morocco in MENA) and a country outside MENA (for example, France in EU&CA) is a non-regional trade flow – that is, reported as a non-regional value chain (NRVC) flow. RVC trade is trade between two countries classified in the same aggregate region (for example, MENA or SSA). NRVC trade is trade between a regional member and any other country outside the region.
Regional production networks, as captured by trade in intermediate goods, failed to develop in MENA and SSA
Table 2 reports the ‘home’ market defined as the cumulative GDP of regional members next to the number of countries in each region. The EA&PA region, with a combined regional GDP of close to $16,000 billion, is over three times the market size of other regions in the table. In EA&PA, the regional share of GVC trade was 21% in 1996, and 27% in 2022.
In our classification, EA&PA includes Australia, China, Hong Kong, Malaysia, Singapore, South Korea, Thailand and Vietnam. It is, in effect, an approximation of ‘factory Asia’. By 2022, the share of intra-regional supply chain trade in EA&PA was over five times larger than in SSA.
Table 2: Regional value chain (RVC) participation versus non-RVC by region: 1996-2022
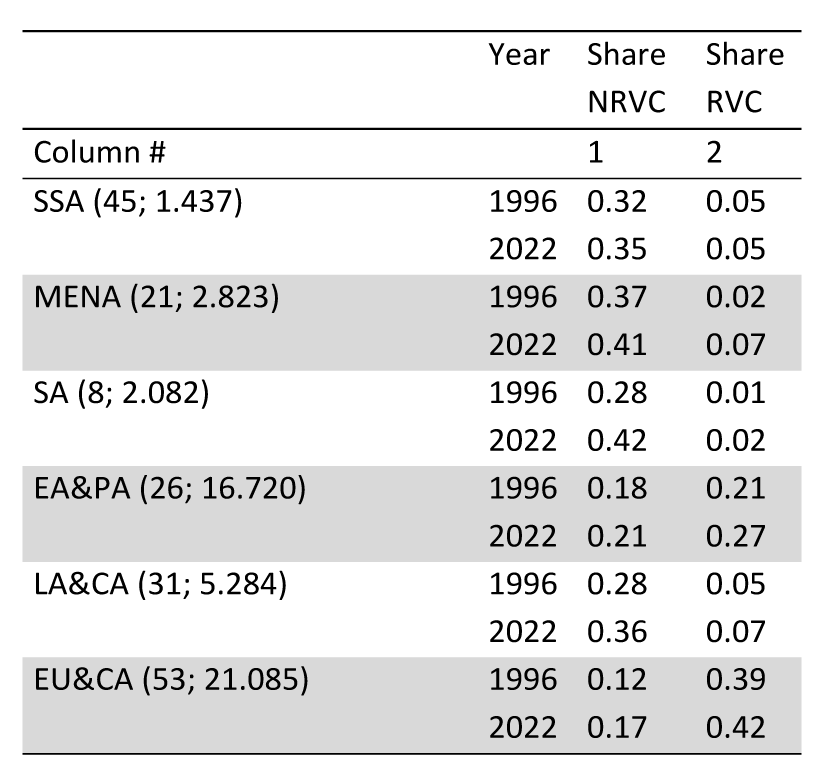
RVCs are defined as trade flows within the regions. NRVCs are all other trade flows.
Source: Melo and Solleder (2025, Table 3)
By contrast, in the other regions, regional production networks failed to reach 10% of GVC trade, even in LA&CA, the region with the largest regional market among contiguous countries.
For SSA, only 5% of gross exports were connected to African supply chains both in 1996 and 2022, while the three-percentage point growth in supply chain trade was entirely with partners outside the region.
The pattern is similar for MENA, but there was also some growth in regional trade in intermediates from 2% to 7%.
For SA, where India is surrounded by low-income countries, regional production networks only accounted for 2% of GVC trade in 2022.
The move towards greater intra-regional trade in intermediate inputs in EA&PA was even stronger for EU&CA, where RVCs accounted for 42% of GVC trade in 2022 (Melo and Solleder, 2025, Table 2). In both regions, countries are both makers and buyers of components and parts. By contrast for both SSA and MENA, enclave-type extractive sectors generate limited domestic linkages.
This sharp contrast in supply chain trajectories across regions has not been highlighted previously, especially for MENA and SSA, where comparisons have focused on differences in trajectories for backward and forward shares rather than on production networks inside and outside the region. This outcome presents a challenge for the AfCFTA project where the growth of RVCs is an important objective.
Slow growth in services in MENA and SSA
Globally, services have become key growth drivers, yet SSA and MENA show weak performance. Between 1995 and 2018, both regions recorded the lowest global growth in services labour productivity. Restrictive policies, reflected in high Services Trade Restrictiveness Index (STRI) scores across Africa further impede services-led transformation (see Fiorini et al, 2026, Figure 2).
Gulf Cooperation Council (GCC) states perform better on digital skills and infrastructure, but SSA least-developed countries lag with restrictive regimes and low internet use (for example, Ethiopia: STRI=88, only 18% of individuals online).
Connectivity gaps are severe. In 2018, 29% of SSA’s population had no 3G coverage, compared with 6% in MENA. Only 22% of SSA’s population used the internet for basic functions, compared with 58% in MENA. High broadband costs, lack of competition and heavy taxation hinder digital adoption.
In our study, we place all MENA and SSA countries on a three-step ‘data infrastructure ladder’. Most SSA and MENA states remain in the early stages (0–2), with limited internet exchange points (IXPs) and data centres (CDCs), while stage 3 is reserved for countries with IXPs and CDCs. These deficiencies situate MENA and SSA countries low on the data infrastructure ladder, contributing to their restricted participation in global e-commerce.
Figure 1 shows the channels through which digitalisation affects manufacturing and services. Baldwin and Forslid (2020), Mayer (2021) and Rodrik and Sandhu (2024) argue that digitalisation will favour a services sector-led transformation for developing countries. Table 3 contrasts GVC participation rates by sectors in the EORA classification according to their prospects for digitalisation (high-tech versus low-tech)
Table 3 : Backward and forward GVC participation by digitaliisation prospects

Source: Melo and Solleder (2026, Table 4)
Table 3 displays several patterns:
- Forward and backward participation rates are broadly similar at the sector level for both regions and both years (for example, low-tech manufacturing).
- Across sectors, SSA has a lower content of imports in its export basket than MENA.
- The import content of exports has increased for MENA, but barely for SSA.
- In MENA, the import content of gross exports has increased for high-tech manufacturing and both category of services.
- For SSA, high-tech manufacturing and high-tech services remain at the start of supply chains with a low import content in gross exports.
- The import content of high-tech services exports for MENA has increased over the period, a likely indicator of improved digital readiness necessary for a services sector-led transformation.
Drivers of GVCs: trade costs and the quality of hard and soft infrastructure
Our study reports regressions of GVC participation measures on three drivers: a model-generated indicator of trade costs; the quality of national data infrastructure captured by mobile subscription rates; and institutional stability. Country and year fixed effects control for omitted factors.
All specifications return statistically highly significant coefficient values with the expected signs:
- Higher mobile subscriptions and higher scores on political stability are associated with higher GVC participation rates.
- Governance displays a positive association with backward GVC participation throughout, with no significant differences for the MENA or SSA regions.
- Digital infrastructure is also a robust correlate in all cases, with only marginally weaker effects in SSA.
Overall, institutional quality and digital infrastructure support GVC integration across the board. The role of trade costs is highly region-specific, constraining SSA much more than MENA.
As examples of differences in orders of magnitude, a 1% increase in telecom subscriptions is linked to a 0.4% direct increase in GVC participation and a 0.25% indirect increase via lower trade costs. Internet platforms reduce export fixed costs, helping small and medium-sized enterprises (SMEs) access global markets.
Higher trade costs are associated with lower backward participation and lower overall GVC participation. The dampening effect of high trade costs on imports is almost twice as significant for SSA than for MENA as a 1% increase in trade costs reduces the import content of exports by 2.5% in SSA and 1.3% in MENA.
Policy recommendations
Exports from MENA and SSA embody fewer intermediate imports in their export baskets than in other regions. This slows growth of supply chains in manufacturing. Removing tariffs on intra-African trade in goods under the AfCFTA should encourage the growth of RVCs.
Both regions, but especially SSA, are handicapped by severe connectivity gaps. Most countries have limited IXPs and CDCs, positioning them in the early stages (0-2) on a three-step data infrastructure ladder.
A services sector-led transformation in both regions will require well performing digital infrastructure. Imbruno et al (2025) show that small firms are penalised by poor digital infrastructure in their penetration of foreign markets. This calls for measures and policies that:
- Invest in digital education and training to equip SMEs with essential skills needed to penetrate foreign markets.
- Provide financial incentives to support digital technology adoption among smaller firms that are most penalised in terms of market access when digital connectivity is poor.
- Encourage regional cooperation to reduce regulatory distance via harmonisation and mutual recognition agreements to streamline digital regulations.
Further reading
Ariu, A, J de Melo and JM Solleder (2026) ‘GVCs, Digitalization and Services in Africa: What we know and what we would like to know’, chapter 8 in Ferracane and Nordås, eds (2026).
Baldwin, R, and R Forslid (2023) ‘Globotics and Development: When Manufacturing is Jobless and Services are Tradable’, World Trade Review.
Ferracane, M, and H Nordås, eds (2026) Digital Trade in Africa: A research Agenda, EUI Press.
Fiorini, M, I Oliván García and M Valdez Quintero (2026) ‘Services export competitiveness in Africa and the role of digital trade-related policies’, chapter 3 in Ferracane and Nordås, eds (2026).
Imbruno, M, J Cariolle and J de Melo (2025) ‘Digital connectivity and firm participation in foreign markets: An exporter-based bilateral analysis‘, Journal of Development Economics 103551.
Mayer, J (2021) ‘Development strategies for middle-income countries in a digital world – Insights from modern trade economics’, The World Economy 44(9), 2515-45.
Melo, J de and JM Solleder (2026) ‘Patterns and Correlates of Supply Chain Trade in MENA and SSA’, forthcoming in Revue d’économie du développement.
Rodrik, D, and R Sandhu (2024) ‘Servicing Development: Productive Upgrading of Labor Absorbing Services in Developing Economies’, NBER WP# 32738.
Sucker, F, and K Banga (2026) ‘AI in African digital trade regulation: Legal and political economy perspectives’, chapter 5 in Ferracane and H. Nordås eds (2026.)