

In a nutshell
Inflation rates in MENA have generally been lower than in Europe and the United States because many countries have implemented policies to contain domestic inflation when global inflation rose.
Inflation in the region is lower than expected because, to varying effect, countries have employed policies that reduced the amount of the higher global prices for food and fuel that have been passed through to the prices that their consumers paid.
Such policies have a fiscal cost: evidence suggests that targeted interventions to support poorer households facing higher food and energy prices are substantially less costly than protecting everyone, including the rich.
The macroeconomic performance of developing countries and emerging markets since the second half of 2021 and especially since the start of the war in Ukraine in February 2022 has been shaped by the global economy’s transition to an environment of higher inflation and higher interest rates. In this article, we draw on the World Bank’s latest MENA Economic Update (World Bank, 2022) to focus on the challenge of inflation, presenting evidence on the imperfect pass-through of global inflation to domestic inflation rates across MENA.
Imperfect pass-through of global inflation
Domestic inflation is driven partly by global inflation and partly by domestic factors. The component of domestic inflation driven by global inflation is called tradable inflation, because it refers to the price behaviour of goods that are traded in international markets and usually denominated in US dollars. Another component of domestic inflation is driven by largely domestic factors that affect the prices of non-traded goods and services.
Tradable inflation for a small open economy is driven by two key variables: global inflation denominated in US dollars; and the country’s exchange rate relative to the US dollar.
Even though they cannot affect the global price of a tradable good, national policy-makers can affect its domestic price through product market interventions that affect the domestic prices of tradable goods – such as price controls or consumption subsidies. Recent research by the International Monetary Fund (IMF) indicates that MENA countries have the lowest pass-through rate from global oil prices to domestic gasoline prices, which suggests that governments intervene in the domestic gasoline market by providing, say, some sort of gasoline consumption subsidies (Amaglobeli et al, 2022).
Another reason why the pass-through of global inflation to domestic inflation is imperfect is because consumers across countries do not consume only tradable goods: they also consume non-traded goods and services, such as doctor visits, schooling, housing or construction. Consequently, domestic inflation need not equal global inflation as tradable goods account for far less than 100% of domestic consumption.
Tradable consumption shares in MENA
The share of tradable goods in total consumption and the variation in a country’s exchange rate (defined as local currency units per US dollar) are key to understanding the extent to which exchange rate fluctuations since the start of the war in Ukraine affect domestic inflation rates.
Estimating the tradable consumption share requires detailed data on the components of the consumer prices index (CPI) for each country. Such data are available for 12 MENA countries – Algeria, Bahrain, Djibouti, Egypt, Iraq, Iran, Jordan, Lebanon, Oman, Qatar, Saudi Arabia and Tunisia – while others have data only for broad product or services categories – Kuwait, Morocco, the United Arab Emirates and the West Bank and Gaza. For these four countries, we rely on informed statistical guesses to impute the tradable consumption share. Figure 1 shows the tradable consumption shares for 16 MENA countries with available CPI data.
Figure 1: MENA tradable consumption shares in CPI consumption baskets
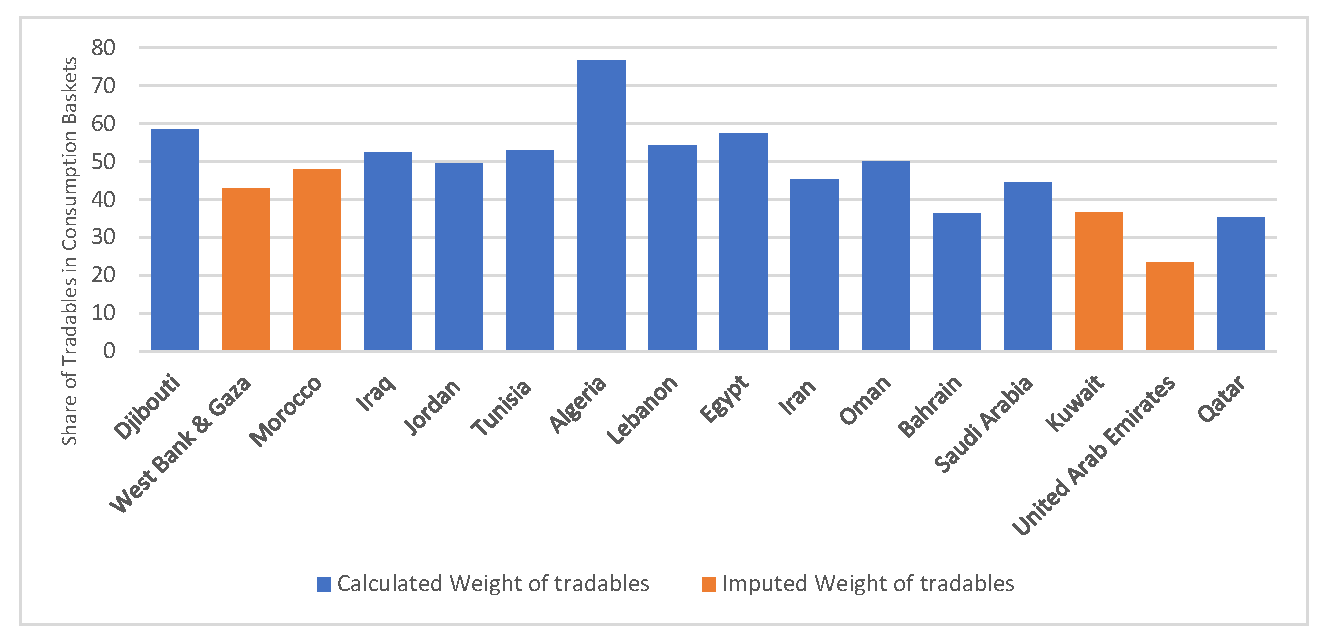
Source: World Bank staff calculations based on data from Haver Analytics and national statistical offices.
Note: The bar chart displays the share of tradable items in the consumption basket of 16 MENA countries. The blue bars represent the calculated share of tradable items for countries with detailed CPI data, used to identify tradable items and their corresponding weights. The orange bars represent the imputed share of tradable items for countries that do not provide public access to detailed CPI data. The imputed share is calculated as the share of goods (COICOP categories 01, 02, 03, 05) plus an adjustment amount of 9.15%, the average difference between the share of goods and the share of tradable items for countries with detailed CPI reporting. Three MENA countries have no publicly available CPI data: Libya, Syria and Yemen.
Exchange-rate-adjusted inflation rates since February 2022
Using these consumption shares, we can calculate the contribution of exchange rate fluctuations since February 2022 to each country’s average year-on-year headline inflation rate between March and July 2022.
Figure 2 displays three statistics for each MENA country. The blue bars show the average year-on-year inflation rates from October 2021 to February 2022, while the orange bars show the average rates from March 2022 to July 2022. The gray bars show the average exchange-rate-adjusted inflation rates from March 2022 to July 2022. These are calculated by removing from the headline inflation number the component that reflects local currency depreciation since February 2022.
As Figure 2 shows, inflation in most MENA countries was lower than in the United States, which is portrayed by the horizontal red line – or would have been lower had exchange rates remained at their levels in February 2022. The two glaring exceptions are Iran and Lebanon, which even before the onset of the war in Ukraine had such high rates of inflation that they are presented on a different scale.
Therefore, the key analytical question is not why inflation has risen to previously unseen levels in MENA, but rather why inflation is not higher.
Figure 2: Exchange-rate adjusted inflation rates across MENA
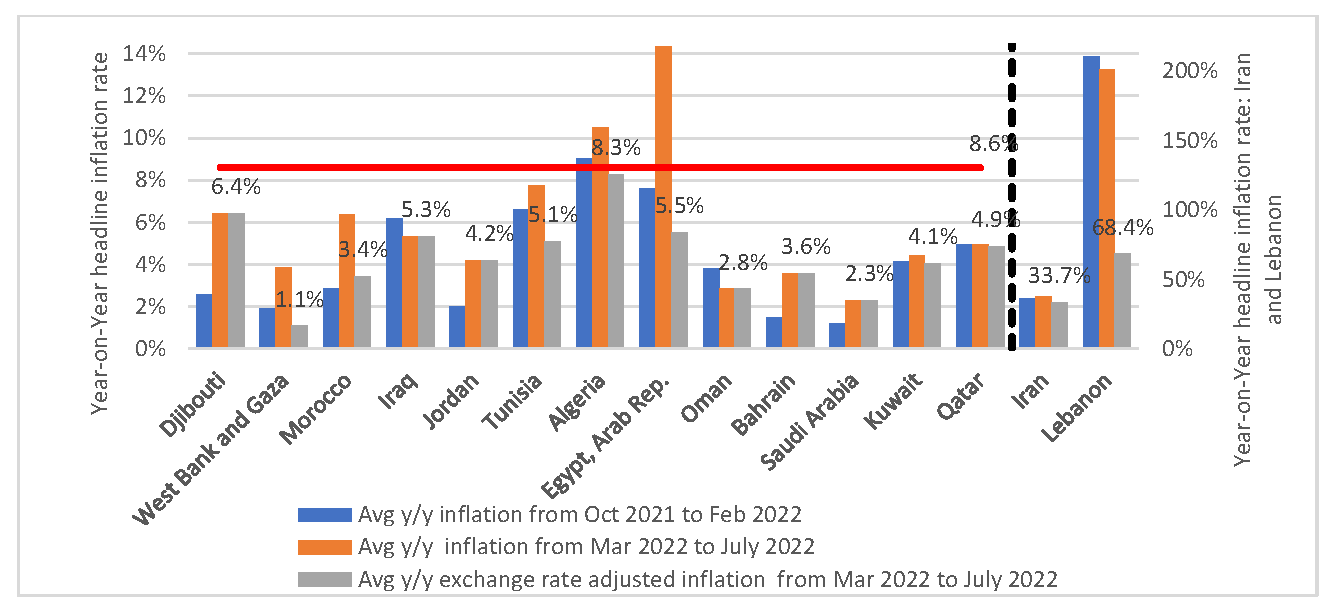
Source: World Bank staff calculations based on data from Haver Analytics and national statistical offices.
Note: The gray bars show what the average year-on-year inflation rate would have been if each country’s bilateral exchange rate with the US dollar had remained at the February 2022 level. The United Arab Emirates is excluded because it does not publish monthly data for the current year. Libya, Syria and Yemen are excluded due to lack of data.
Estimates of the impact of tradable product market policies since February 2022
Inflation is lower than expected in MENA because, to varying effect, MENA countries employed policies that reduced the amount of the higher global prices for food and fuel that were passed through to the prices their consumers paid.
Figure 3 shows the extent to which product market policies implemented since February 2022 have affected inflation across MENA countries. The orange bars represent average reported inflation from March to July 2022, while the gray bars show the counterfactual average inflation rate that would have been observed had there been no changes in product market policies for the period March to July 2022. The effect of product market policies on inflation is calculated by removing the impact of the exchange rate depreciation and global tradable inflation components from headline inflation.
For most of the MENA countries in this sample, the counterfactual inflation rates would have been higher than the actual rates. In Egypt, for example, the average year-on-year inflation rate in March to July 2022 was 14.3%, but it would have been 18.4% if the authorities had not intervened in tradable product markets. In other words, Egyptian government interventions reduced inflation by more than 4 percentage points.
Only Djibouti, Iran and Jordan show evidence of having policy changes that resulted in a net increase in inflation. One potential explanation for the Djibouti and Jordan cases is that this was an unintended consequence of the imposition of price controls in these countries. Controls have ambiguous effects on prices, because they tend to be associated with growing scarcity and rising black market prices. In addition, Jordan raised price ceilings on some products.
Figure 3: Estimates of the impact of tradable product market policy responses on headline inflation, March to July 2022
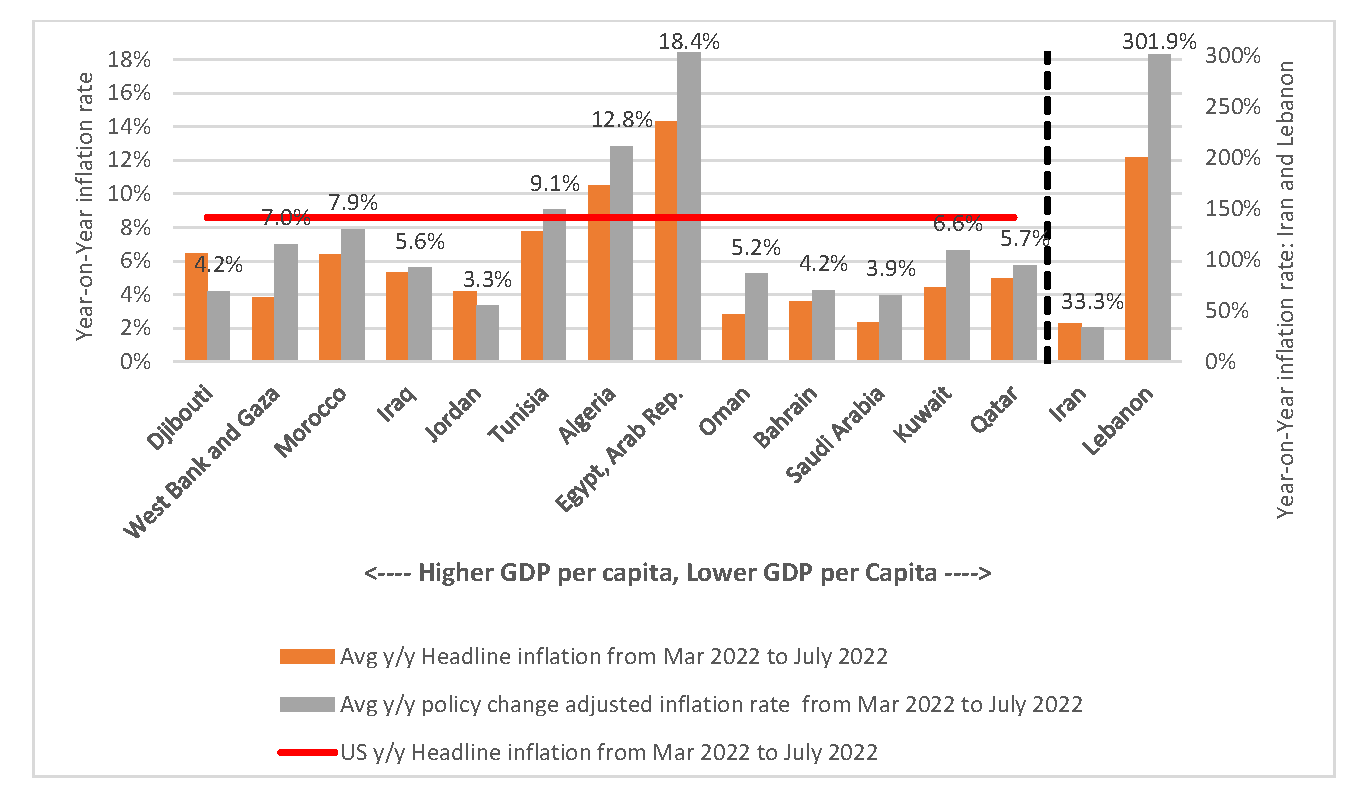
Source: World Bank staff calculations based on data from Haver Analytics and national statistical offices.
Note: The United Arab Emirates is excluded because it does not publish monthly data for the current year. Libya, Syria, and Yemen are excluded due to lack of data.
We have shown that most countries in the sample succeeded in attenuating domestic inflation in response to rising global inflation. That is the good news, but lower inflation came at a fiscal cost.
Fiscal implications of compensation schemes
We next present estimates of the relative fiscal costs of two compensation schemes: universal subsidies versus targeted cash transfers. This analysis is provided for Egypt, Morocco and the West Bank and Gaza, which have the best household survey data to conduct this type of analysis.
If we assume that the entire effect of policy changes on observed headline inflation shown in Figure 3 works through food and energy prices, we can transform the total reduction in inflation into an equivalent direct support payment to the population to compensate them for the rise in food and energy prices.
For Egypt, where food and energy consumption represented 43.5% of total consumption in 2018, the 4.1 percentage-point reduction in average headline inflation translates into a 9.4 percentage point reduction in the total increase in the prices of food and energy observed between February and July. Instead of using across-the-board product market interventions, Egypt could have allowed bigger increases in the prices of food and energy based on market dynamics, while compensating the population for the additional 9.4 percentage point increase in food and energy prices.
Thus, it is possible to produce a rough estimate of the fiscal costs of these product market interventions. It is also possible to compare the relative costs of targeting just the poorest segments of the population (as with a targeted cash transfer system) with the cost of providing relief to the entire population (as with a general subsidy).
Figure 4 Panel A provides the results of this analysis for Egypt. The orange line plots the cumulative costs as a percentage of GDP by household consumption decile. Compensating just the lowest decile would cost 0.086% of GDP, while compensating the two lowest deciles would cost 0.184% of GDP, up to a total cost of 1.136% of GDP if the entire population was compensated.
It is worth noting that this estimate for Egypt is probably an underestimate because the household consumption totals reported in the survey are too low at approximately 33% of GDP, whereas the national accounts report a household consumption (plus consumption by not-for-profit organisations on services for the poor) of approximately 85% of GDP. So, it is likely that the true fiscal cost of compensating all households for the stated food and energy price shock is probably closer to 2% of GDP. The data for Morocco and the West Bank and Gaza suffer much less from this aggregate measurement error than the micro data from Egypt.
Further, the blue lines in Figure 4 show the relative costs of compensating the entire population, as with an across-the-board subsidy, compared to the costs of targeting the poorest. These estimates of relative magnitudes are unaffected by aggregate measurement errors in total household consumption. For the first decile, this is equal to 1.136% of GDP/0.086% of GDP or 13.2 times. For the first two deciles combined, it is equal to 6.2, and so on. Thus, it would cost 13.2 times more to compensate the entire population for a 9.4 percentage point increase in food and energy prices than to compensate just the lowest decile – a much larger fiscal cost.
Figure 4: Fiscal costs of product market interventions since February 2022
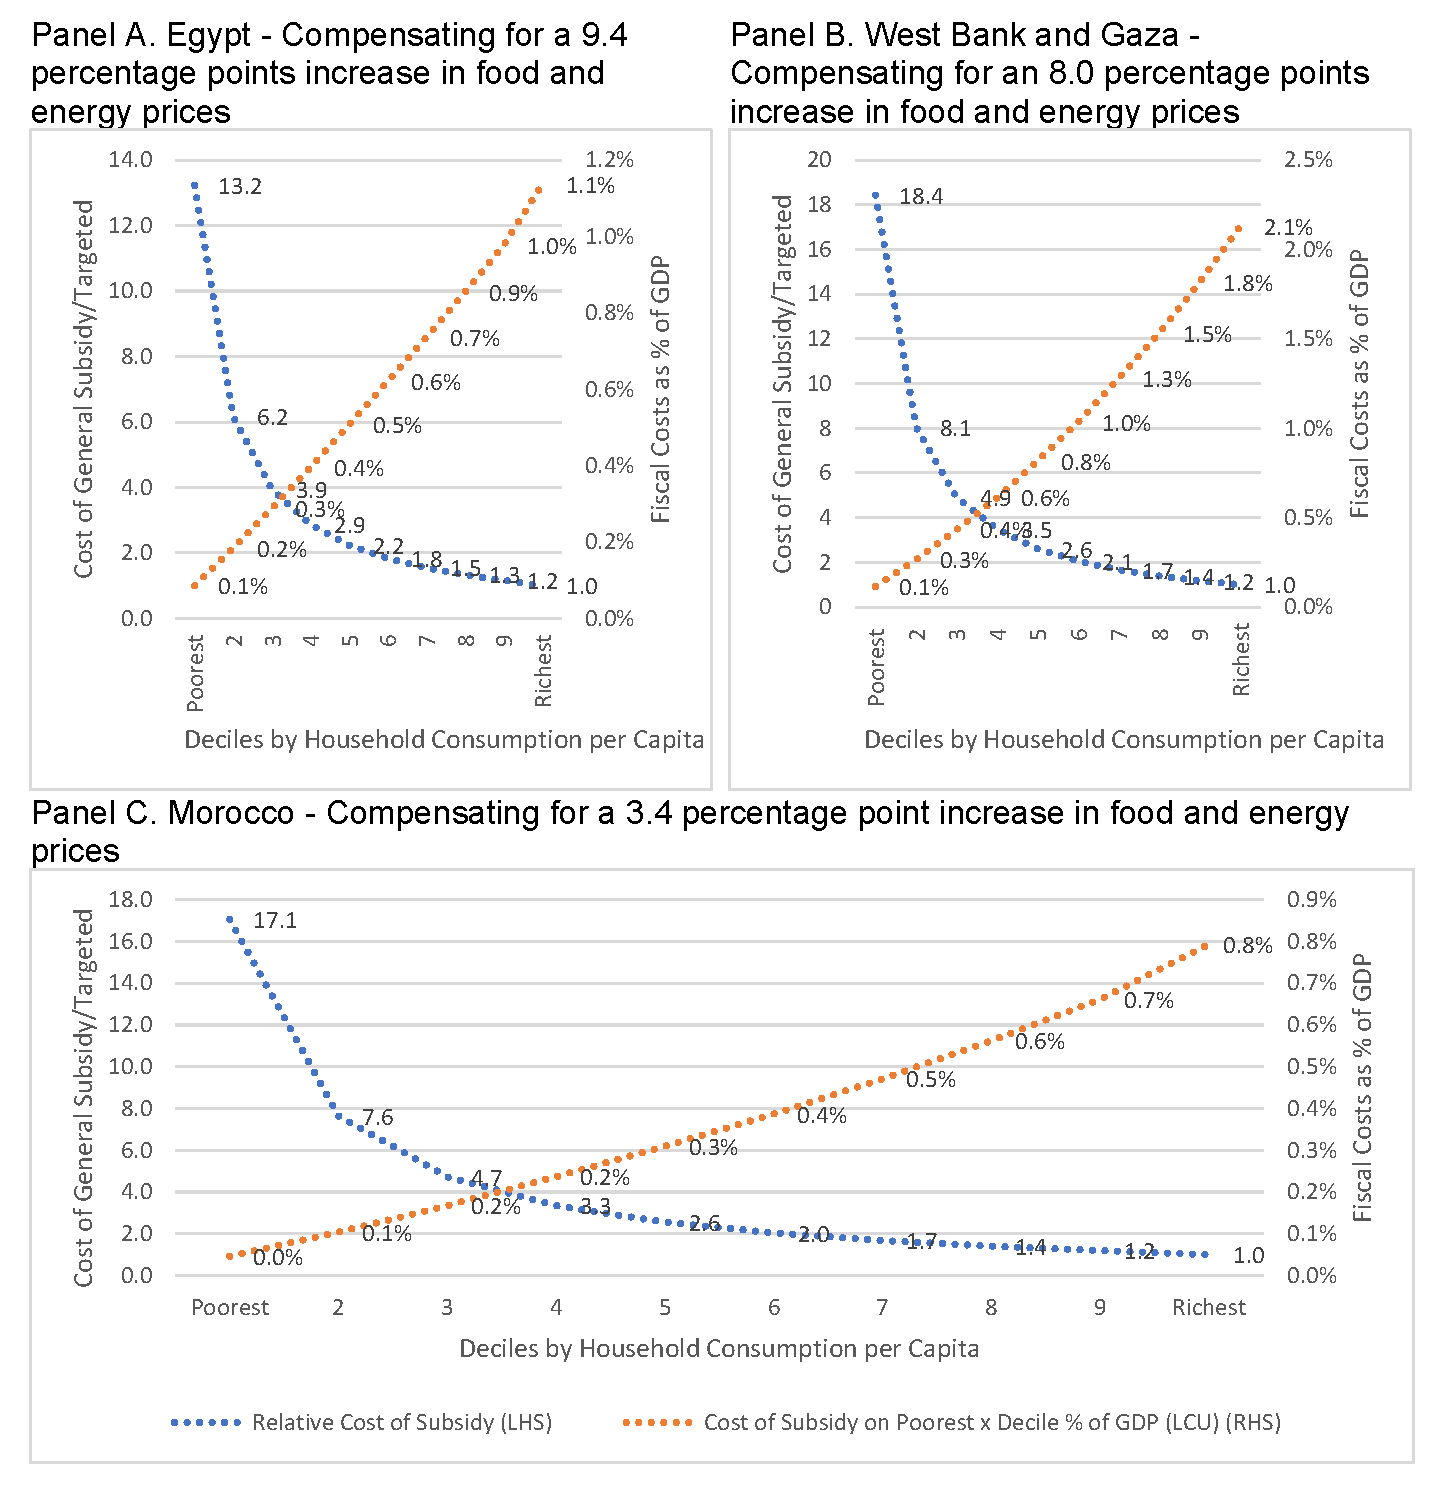
Source: Authors’ calculations based on data from the 2018 household survey and CPI data from Capmas for Egypt, 2016 PECS and CPI data for the West Bank and Gaza and 2013-2014 HBS and CPI data for Morocco.
Note: The blue line (using the left-hand side axis) measures the relative fiscal costs of compensating the entire population over the costs of targeting each decile from poorest to richest on a cumulative basis. Thus, it is equal to 1 at the richest decile. The orange line (using the right-hand side axis) measures the cumulative fiscal costs of compensating the population across deciles. GDP and survey data are in nominal local currency units as of 2018 (Egypt), 2016 (West Bank and Gaza) and 2014 (Morocco). The results take into account the differences in household sizes across deciles, with lower deciles having more members than richer ones. Food and energy price shocks are estimated as the effect of policy changes on headline inflation divided by the share of food and energy consumption in national household consumption baskets.
Figure 4 Panels B and C provide equivalent estimates for Morocco and the West Bank and Gaza. Allowing the prices of food and energy to increase further while compensating the entire population for these increases, by providing food and energy consumption subsidies, for example, would be 17 times and 18 times more costly, respectively, in Morocco and the West Bank and Gaza than supporting the poorest 10% of households with cash transfers.
Conclusion
This article has shown that the inflation rates in most MENA countries has been lower than in Europe and the United States since the start of the war in Ukraine. This is because many countries implemented policies to contain domestic inflation when global inflation rose. Our estimates suggest that in most MENA countries with available information, the net impact was to reduce inflationary pressures.
Unfortunately, such policies also have a fiscal cost. The evidence suggests that targeted interventions to support poorer households facing higher food and energy prices are substantially less costly than protecting everyone, including the rich.
Further reading
Amaglobeli, David, Emine Hanedar, Gee Hee Hong and Céline Thévenot (2022) ‘Response to High Food, Energy Prices Should Focus on Most Vulnerable’, IMF blog, 7 June 2022.
Belhaj, Ferid, Roberta Gatti, Daniel Lederman, Ernest John Sergenti, Hoda Assem, Rana Lotfi and Mennatallah Emam Mousa (2022) ‘A New State of Mind: Greater Transparency and Accountability in the Middle East and North Africa. Middle East and North Africa Economic Update (October)’, World Bank.