In a nutshell
It is possible that household surveys underestimate inequality in Egypt, failing to capture top incomes, either because of non-response by the rich or under-reporting of their incomes – or both.
This research uses data on house prices to estimate the top tail of the income distribution.
Using this method, the Gini coefficient of household income for urban Egypt increases from 0.39 to 0.52.
The estimates are derived from national household surveys that collect detailed income or consumption data for a sample of households, which are assumed to be representative of the country’s population.
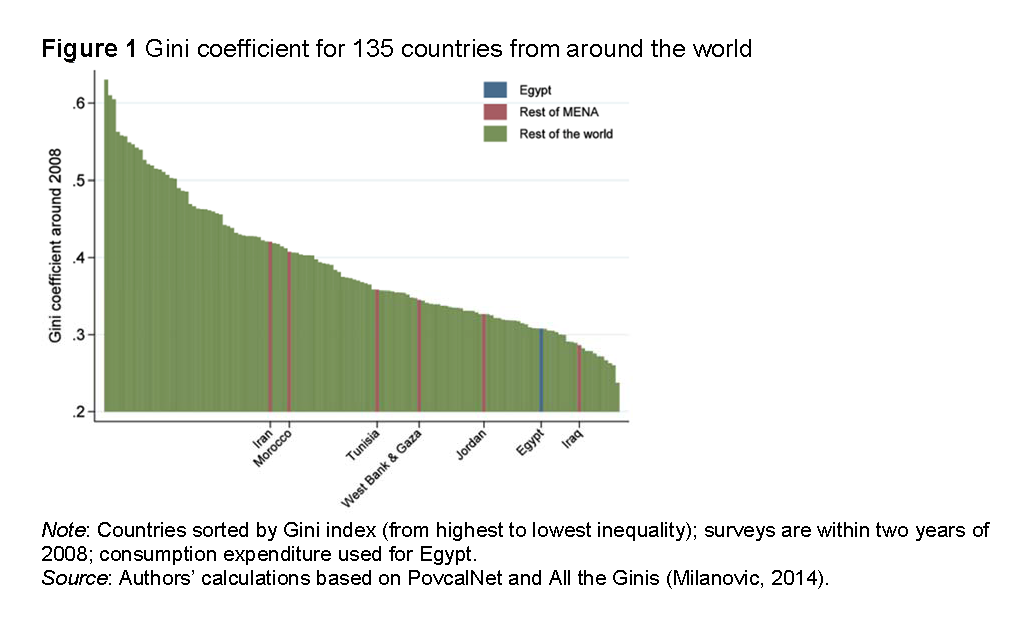
The Gini coefficient, arguably the most commonly used measure of inequality, ranges between 0 and 1 with higher values indicating more inequality. To obtain estimates of the Gini coefficient for 135 countries around 2008-09 (the most recent period for which we have survey data for Egypt), we use the World Bank PovcalNet, a repository of household income and consumption surveys from around the world.
Figure 1 shows the results, with the most unequal countries on the left, becoming progressively more equal as we move to the right. Egypt’s Gini coefficient is just over 0.3, which is low by international standards. It is even low by the standards of the region, as the highlighted countries show.
This will come as a surprise to many Egyptians. For example, research by economist Ragui Assaad finds that a child from a disadvantaged family has a one in ten chance of going to university while a child from a privileged family is virtually guaranteed to make it to university.
In addition, taxes have become more regressive, particularly since 2005, and signs of inequality have become increasingly visible during this period. As freelance journalist Osama Diab writes, ‘In Egypt, where luxury hotels and upscale neighbourhoods abut sprawling informal settlements, inequality is out in the open, bringing with it the constant potential for social unrest.’
The increased level of inequality may not have been the decisive issue in the social unrest that began in 2011, although it may well have contributed. Protesters were motivated by both economic and political grievances – and many of those grievances are related to inequality: the deterioration in public education and healthcare, chronic corruption, crony capitalism, police brutality, poor working conditions, low pay and lack of accountability.
Egyptians who can afford it rely increasingly on private education and healthcare, contributing to ‘social separatism’. Post-Mubarak, leading political parties have made economic inequality a defining issue in their election manifestos.
So is Egypt’s inequality higher than official estimates? It is possible that household surveys underestimate inequality, failing to capture top incomes, either because of non-response by the rich or under-reporting of their incomes – or both.
One solution to this problem is to estimate the top tail of the income distribution from income tax record data, then estimate the rest (often 99%) of the income distribution using the household survey, and combine the two. Income tax records arguably are the ideal source of data, but they are usually hard to find. Egypt is no exception, so a re-estimate in this case requires alternative top income predictors.
Our research uses data on house prices to estimate the top tail of the income distribution. The house price database is compiled from real estate listings that are available in the public domain. We estimate the relationship between the house price (or the implied rent) and household income using the household survey.
We find evidence that inequality is considerably underestimated in Egypt. Using this method, the Gini coefficient of household income for urban Egypt increases from 0.39 to 0.52. This would move Egypt to the middle of the pack in Figure 1.
There are caveats when we rely on predictors of this kind. We make assumptions about the functional form of the relationship between rents and household income, and about the functional form of the upper tail of the house price distribution. In addition, we assume that one house constitutes one household and that all houses are domestically owned. Therefore, in cases where tax record data are available, these should undoubtedly be considered first.
Nevertheless, we believe that this approach will provide more reliable estimates of inequality than estimates obtained using survey data alone. The perfect should not be the enemy of the good.
Inequality estimates for other countries may also be downward biased. When household surveys are combined with income tax data, the Gini coefficient for the United States in 2006 increases from 0.59 to 0.62; for Colombia in 2010, from 0.55 to 0.59; and for Korea in 2010, from 0.31 to 0.37. Where Egypt will ultimately rank in a completely revised version of Figure 1, nobody knows.
Further reading
Van der Weide, Roy, Christoph Lakner and Elena Ianchovichina (2016) ‘Is Inequality Underestimated in Egypt? Evidence from House Prices’, World Bank Policy Research Working Paper No. 7727; forthcoming in the Review of Income and Wealth.
A longer version of this column is available at VoxEU.


