In a nutshell
Despite attention-grabbing headlines about their positions at the lower end of global average happiness rankings produced in the World Happiness Report, a median-based examination reveals that Arab nations are on par with the world's happiest societies.
While the Netherlands has higher average happiness than Egypt, Iraq, Jordan and Tunisia, it does not dominate Lebanon, Libya or Morocco; indeed, the Netherlands does not dominate any of the seven Arab countries in terms of absolute socio-economic inequality in happiness.
When considering the role of happiness in guiding policy decisions, Amartya Sen's concept of capabilities should be central, according to which, the pursuit of happiness and fulfilment becomes a matter of personal agency once equitable social conditions have been established.
On this year’s International Day of Happiness, 20 March 2024, a stark headline in L’Orient Today caught the eyes of many: ‘Lebanon ranked second unhappiest country in the world’. Nestled within the pages of the World Happiness Report of 2024 lies a ranking of 143 nations measured by the ‘average happiness’ level within their borders. Besides Lebanon, other Arab countries also do not rank well on this list. How much should we be concerned about this result?
The World Happiness Report uses a question from the Gallup World Poll. This question asked respondents to assess their happiness on a scale of 1 to 10. Unfortunately, access to the Gallup World Poll is restricted. But an alternative poll – the World Value Survey Wave VII – includes a question that asks respondents to assess their happiness in one of the four following categories: ‘Not at all happy’, ‘Not very happy’, ‘Quite happy’ and ‘Very happy’.
Seven Arab countries are included in the latest wave of the World Value Survey and the Gallup World Poll: Egypt, Iraq, Jordan, Lebanon, Libya, Morocco and Tunisia. Six of these seven are in the bottom half of the World Happiness Report ranking, with only Libya, at 66th in the top half. The others rank: Iraq 92nd; Morocco 107th; Tunisia 115th; Jordan 125th; Egypt 127th; and Lebanon 142nd.
Since health surveys often ask respondents to assess their overall health according to ordinal categories, research on socio-economic health inequality has highlighted some issues linked with the use of summary statistics, such as the average, when applied to ordinal variables (see Allison and Foster, 2004; Zheng, 2008; and Makdissi and Yazbeck, 2014 and 2017).
This column illustrates how we can rank the seven Arab countries with respect to their distribution of ‘happiness’ and how they compare with an international reference point, the Netherlands, which is one of the top countries, ranked 6th, in the World Happiness Report ranking. I use the Netherlands as a reference point because it is the country that appears in the World Value Survey Wave VII and has the highest ranking in the World Happiness Report ranking.
The first important thing that previous research points to is that the average is not a reliable summary statistic when applied to ordinal data. This lack of reliability is linked to the nature of ordinal information. To compute the average of an ordinal variable, one needs to assign an increasing numerical scale to the categories. This numerical scale can be any monotonically increasing scale. In this sense, the choice of one specific numerical scale is arbitrary.
Let us now illustrate the potential issue with a simple example. Consider the following distribution of happiness among ten individuals: Not at all happy, Not very happy, Not very happy, Quite happy, Quite happy, Quite happy, Very happy, Very happy, Very happy, Very happy. Now, assume two different numerical scales are applied to the categories. Scale 1 is (1, 2, 3, 4), and Scale 2 is (1, 12, 13, 14).
Both numerical scales convey precisely the same ordinal information. If one computes the average level of happiness using Scale 1, the result is 3. Using Scale 2, the result would be 12. The numerical value of the average is different, but this is not such a big issue since the numerical scales are different. But if one refers to the ordinal category assigned to the average value using Scale 1, the average happiness level is Quite happy; with Scale 2, one would get Not very happy.
The qualitative interpretation of the average value differs, which constitutes a significant drawback. This is why mathematicians, statisticians, and most economists recommend not using the average as a summary statistic for a distribution of ordinal variables.
In these circumstances, one simple and robust alternative relies on a different measure of centrality: the median, that is, the ordinal category, such that 50% of the population is below and 50% is above. The median category is invariant to the choice of the arbitrary numerical scale.
Figure 1 displays the map of the median level of happiness in the world. Except for a few countries in Latin America, two countries in Central Asia, the Philippines and Kenya, with a median level of Very happy, all other countries’ median level is Quite happy.
Figure 1: A world map of median happiness

The seven Arab countries included in the World Value Survey have a median level of happiness matching the Netherlands, which ranked 6th according to the average level of happiness estimated in the World Happiness Report of 2024. For the remainder of the column, we will compare the seven Arab countries among themselves and with the Netherlands as an international reference point.
Allison and Foster (2004) argue that if one is interested in ranking countries according to their average level of an ordinal variable, such as happiness, one should check for first-order stochastic dominance on the distribution of this variable to identify rankings that remain the same for all increasing numerical scales. Only if one country first-order dominates the other, its average level of happiness is higher for any increasing numerical scale applied to the ordinal variable.
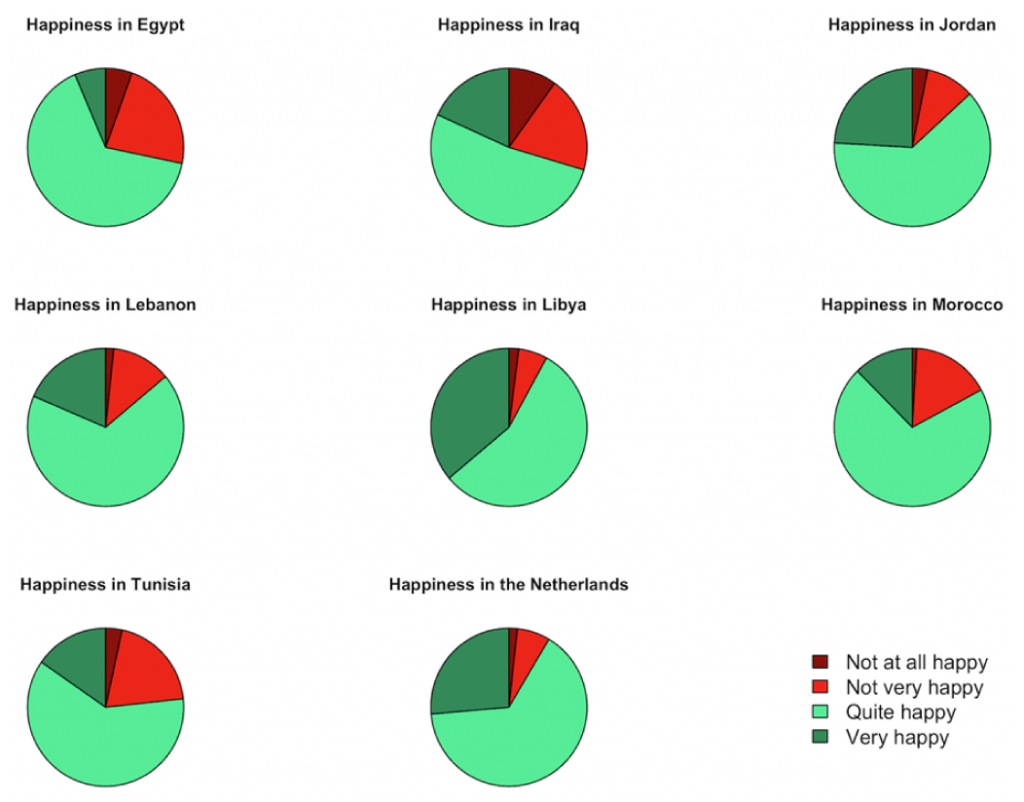
For an ordinal variable, the visual representation of the first-order dominance condition can be pictured by comparing pie charts. Using pie charts based on the four happiness categories, you start at a fixed point, commonly at the top (12 o’clock position), to ensure consistency across charts. For a country to demonstrate first-order stochastic dominance over another:
- The pie chart segment for Not at all happy should be smaller for the dominating country than the dominated country.
- When you add the Not very happy segment to the Not at all happy segment, this combined segment should also be smaller in the dominating country’s pie chart.
- Adding the Quite happy segment to the previous two, the combined segment should continue to be smaller in the pie chart of the dominating country.
As a result, at each cumulative step (adding one level of happiness to the other), the proportion of people at or below that happiness level should be smaller for the country that is better off (that is, the country demonstrating first-order stochastic dominance). This visual comparison can quickly show that one country has a higher average level of happiness than the other because, at each level of happiness, a smaller proportion of the population is at that level or a less happy level.
Figure 2 displays the population proportions in each happiness category in the seven Arab countries plus the Netherlands. Looking at these pie charts, we can say that Libya has higher average happiness than Jordan. Jordan, Lebanon and Libya have higher average happiness than Egypt, Iraq and Tunisia. Morocco and Tunisia have higher average happiness than Egypt. If we focus on our international reference, the Netherlands has higher average happiness than Egypt, Iraq, Jordan and Tunisia, but it does not dominate Lebanon, Libya or Morocco.
Figure 2: Happiness in the Arab world

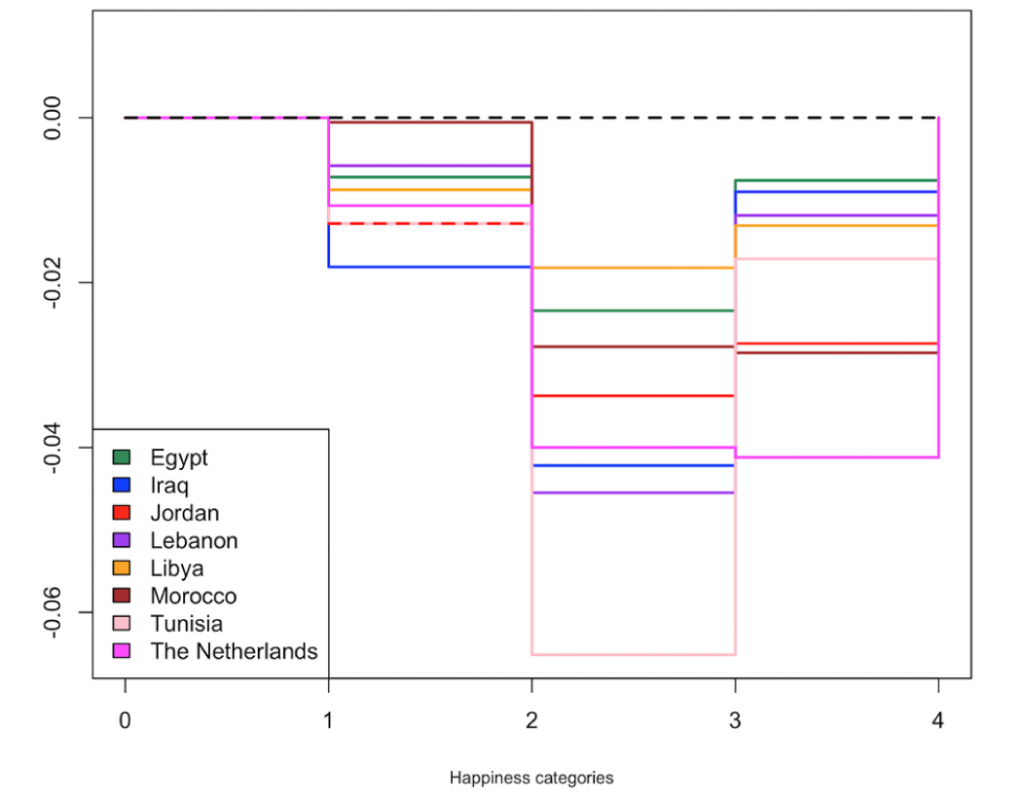
Let us now turn to socio-economic inequality in happiness. Makdissi and Yazbeck (2017) argue that reweighting each observation using the social weight function embedded in the concentration index and looking at the cumulative sum of these weights by categories allows us to compare distributions in terms of absolute socio-economic inequality in the distribution of the health variable. The higher the stepwise curve produced by cumulating these weights, the lower the absolute socio-economic inequality as defined by the absolute version of the canonical concentration index.
Figure 3 applies Makdissi and Yazbeck’s (2017) condition. From this figure, one can conclude that Egypt has less absolute socio-economic inequality in happiness than Iraq, Jordan and Tunisia. In addition, Lebanon has less absolute socio-economic inequality in happiness than Tunisia.
Figure 3: Socio-economic inequalities in happiness in the Arab world

It is worth mentioning that the Netherlands does not dominate any of the seven Arab countries in terms of absolute socio-economic inequality in happiness. But Egypt, Libya and Morocco all have less absolute socio-economic inequality in happiness than the Netherlands. All the other comparisons in terms of the absolute concentration index are not robust to the arbitrary choice of the numerical scale.
In sum, despite the attention-grabbing headlines regarding their positions at the lower end of global average happiness rankings produced in the World Happiness Report, a median-based examination reveals that Arab nations are on par with the world’s happiest societies.
This raises important considerations for the role of happiness in guiding policy decisions. While it might seem attractive from a utilitarian standpoint to leverage these variables, development objectives often derive from Amartya Sen’s concept of capabilities, which focuses on equalising the sets of social functioning available to citizens. According to Sen’s framework, the pursuit of happiness and fulfilment becomes a matter of personal agency once equitable social conditions in the capabilities space have been established by policy-makers.
Further reading
Allison, RA, and JE Foster (2004) ‘Measuring health inequality using qualitative data’, Journal of Health Economics 23: 505-24.
Makdissi, P, and M Yazbeck (2014) ‘Measuring socioeconomic health inequalities in presence of multiple categorical information’, Journal of Health Economics 34: 84-95.
Makdissi, P, and M Yazbeck (2017) ‘Robust rankings of socioeconomic health inequality using a categorical variable’, Health Economics 26: 1132-45.
Zheng, B (2008) ‘Measuring inequality with ordinal data’, Research on Economic Inequality 16: 177-88.
The work has benefited from the comments of the Technical Experts Editorial Board (TEEB) of the Arab Development Portal (ADP) and from a financial grant provided by the AFESD and ADP partnership. The contents and recommendations do not necessarily reflect the views of the AFESD (on behalf of the Arab Coordination Group) nor the ERF.


