In a nutshell
When oil rents in Iran rise unexpectedly – due to such factors as a surge in oil prices or increased exports after sanctions are lifted – there is an increase in levels of corruption in the country, as reported by a major national media outlet.
Higher oil rents exacerbate the risk of corruption either by weakening democratic institutions or by reinforcing autocratic rule; increased oil revenues also tend to boost inflation and military spending, creating an environment ripe for corruption to flourish.
Increased public corruption can encourage individuals to maximise resource extraction for personal gain, leading to the neglect of necessary economic and political reforms and efforts to achieve economic diversification.
Oil rents are a vital source of foreign exchange revenue for Iran. Data from OPEC (2023) indicate that oil constituted about 92% of Iran’s total export revenues in the period before the Islamic Revolution (from 1960 to 1978). Although this proportion decreased after the revolution, it has remained significant, averaging around 71% from 1979 to 2021.
Corruption has become an increasingly significant institutional challenge in Iran. Since 1996, the control of corruption score for Iran – which reflects both petty and grand corruption – has consistently been negative (World Bank 2023). Recently, corruption levels have risen, prompting a pressing question: what role do oil rents play in exacerbating corruption in Iran?
There has been little long-term analysis of the dynamic relationship between oil rents and corruption in Iran. Given the impact of high corruption levels and a young demographic structure on political instability (Farzanegan and Witthuhn, 2017), investigating this relationship is more crucial than ever.
Corruption in resource-rich countries
Scholars generally argue that in countries with limited natural resources, governments must rely on taxing organisations and individuals, which increases the pressure for accountability and transparency (Ross 2012). The reliance on taxation heightens the risk of corruption detection due to the associated accountability demands.
In contrast, in resource-rich countries, governments can fund their expenditures through revenues from natural resources, thereby reducing the need for taxation and lessening the urgency of enhancing formal institutions. Research indicates that in these resource-rich countries, individuals often engage in rent-seeking behaviour, while governments may support their allies through redistributive measures such as public employment, subsidies and investment projects (Bjorvatn and Farzanegan, 2013; Torvik, 2002).
In a recent study, we examine the dynamic relationship between oil rent shocks in Iran and various types of corruption – specifically, indicators of corruption based on news content and on the judgments of country experts (Farzanegan and Zamani, 2024a).
Our analysis reveals that higher levels of oil rents exacerbate the risk of corruption either by weakening democratic institutions or by reinforcing autocratic rule, among other factors. Additionally, increased public corruption can encourage individuals to maximise resource extraction for personal gain, leading to the neglect of necessary economic and political reforms and efforts to achieve economic diversification.
Data
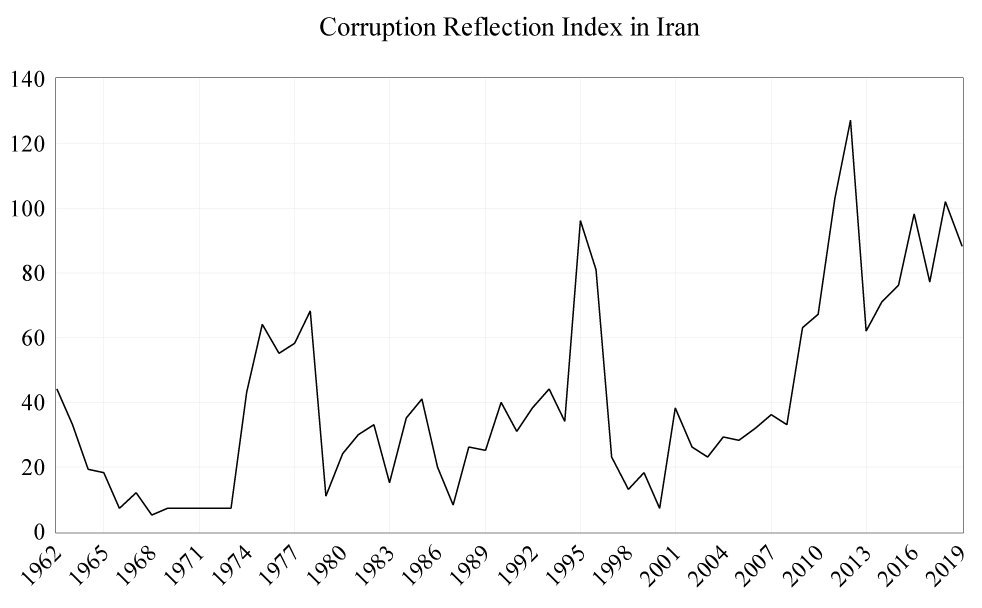
One measure of corruption used in our study is the corruption reflection index (CRI), initially introduced in Farzanegan and Zamani (2024b). Following the methodologies of Dincer and Johnston (2017) and Dincer and Teoman (2019), Farzanegan and Zamani (2024b) conducted an in-depth search for Persian news content related to corruption, including equivalents of the words ‘corruption,’ ‘bribe,’ ‘embezzlement’ and ‘fraud’, in the newspaper Ettelā’āt. Figure 1 presents the trends in the CRI in Iran from 1962 to 2019, highlighting three significant spikes. The first occurred in the five years leading up to the 1979 revolution, a period marked by a sharp rise in oil revenues from 1974 and increasing political instability from 1976. The second aligns with the early years of Hashemi Rafsanjani’s presidency (from 1989 to 1997), which were marked by economic adjustment policies. The third began in 2009, during Mahmoud Ahmadinejad’s presidency.
Figure 1: The corruption reflection index (CRI) in Iran
We also use corruption indicators from the V-Dem (Varieties of Democracy) database, developed by the University of Gothenburg. V-Dem aggregates expert assessments to estimate corruption, with the contributors typically being knowledgeable professionals from the countries they assess. Key V-Dem variables include measures of regime corruption, a political corruption index, an executive corruption index, and a public sector corruption index. All are scaled from 0 to 1, with higher values indicating a greater perception of corruption.
We find a significant correlation between these V-Dem indicators and the CRI. But both indices have limitations: the news-based index may be influenced by government control over media; while the V-Dem index might be biased by the subjectivity of experts. These factors should be considered when interpreting the results (Gutmann et al. 2020).
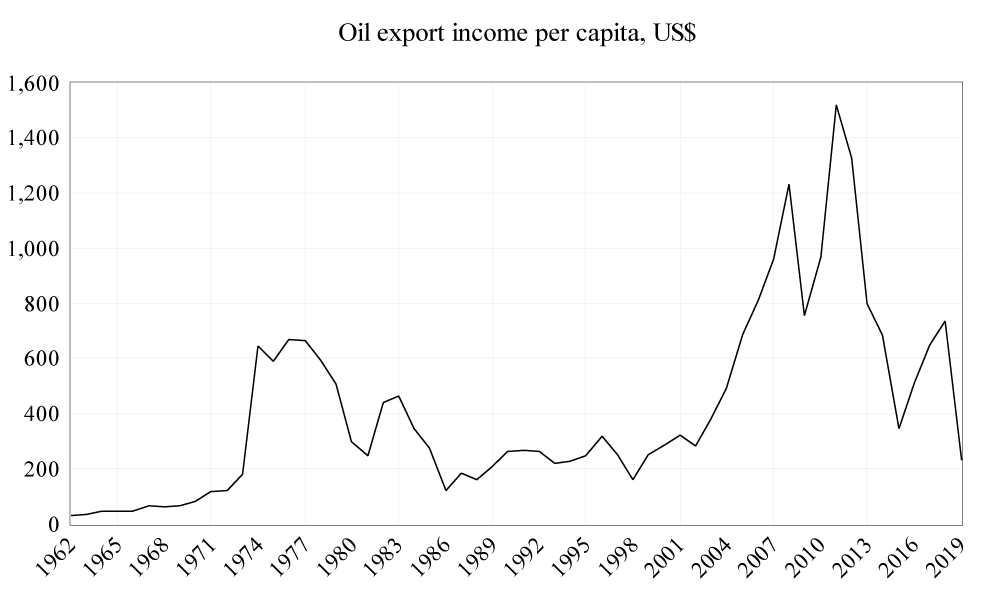
Our variable for oil rents measures the value of petroleum exports per capita, expressed in US dollars, using data from OPEC (2023). Figure 2 illustrates its trends over the period that we analyse.
Figure 2. Oil export income per capita in Iran
Other variables included in our analysis are the GDP growth rate, the inflation rate, military spending (as a percentage of GDP) and a proxy for political institutions.
The response of corruption to oil rent shocks
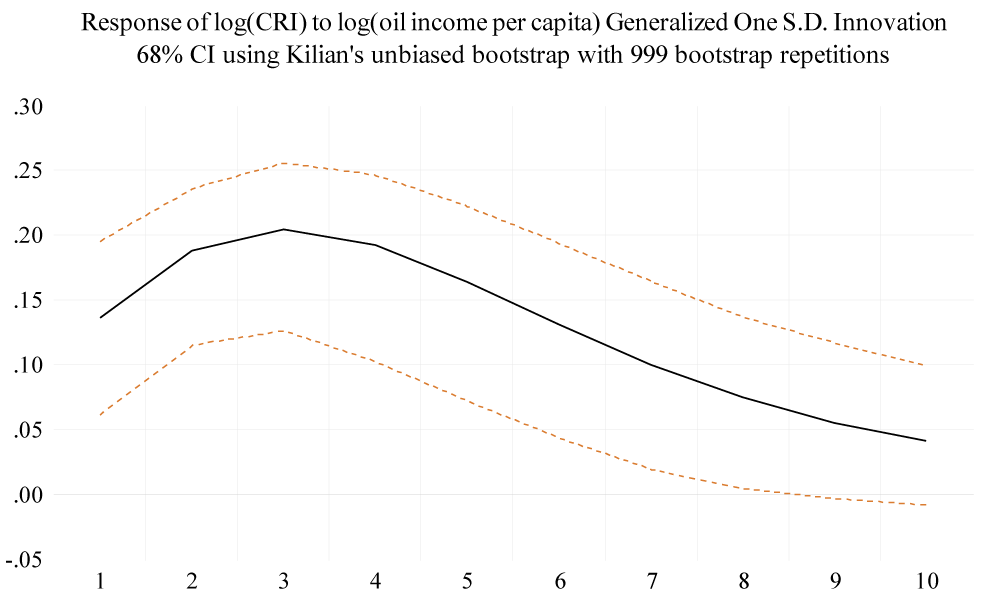
Figure 3 illustrates that the CRI responds positively to increases in oil rents in Iran. When oil rents rise unexpectedly – due to such factors as a surge in oil prices or increased exports after sanctions are lifted – corruption levels also rise, as reported by a major Iranian media outlet. The highest levels of corruption are observed in the second and third years after an oil shock, with the effect remaining for up to seven years. Oil booms create an environment in which corruption can flourish.
We further analyse this relationship by adjusting the CRI using various metrics, including normalisation by the total number of daily pages in the Ettelā’āt newspaper, the number of pages dedicated to political and economic topics, and the number of relevant pages each year. Despite these adjustments, the main finding in Figure 3 remains unchanged.
Figure 3: Response of log (CRI) to log (oil income per capita) shock
Potential mechanisms: inflation
Positive oil income shocks may increase corruption through their impact on inflation. According to the Dutch disease hypothesis, rising oil rents lead to higher government spending on both tradable and non-tradable goods, which drives up prices in the non-tradable sector due to supply constraints (Farzanegan and Markwardt, 2009).
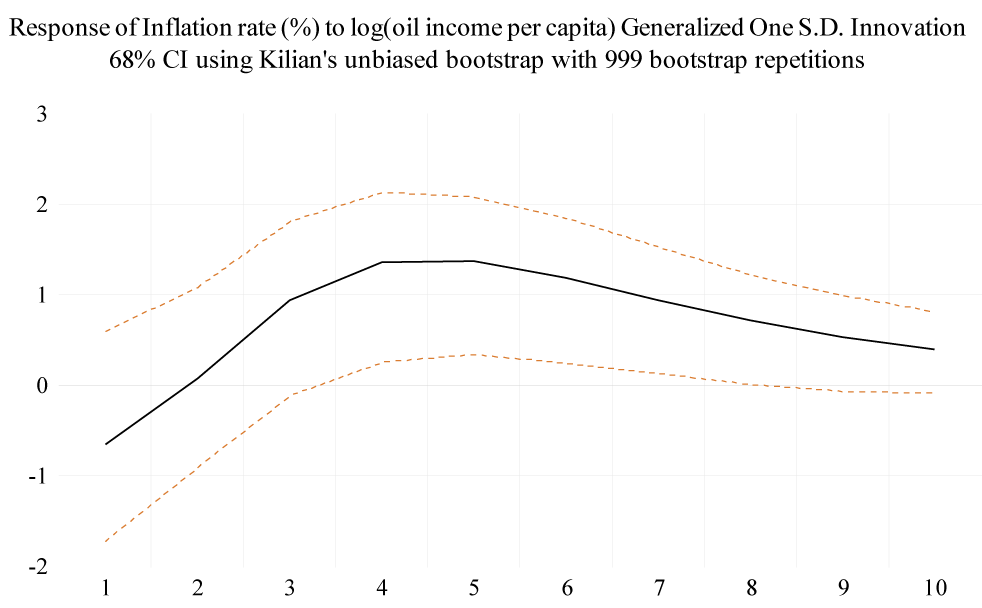
Is there evidence in the period from 1962 to 2019 that inflation in Iran responds positively to oil shocks? Figure 4 shows that the inflation rate increases in response to a positive shock in oil income per capita, peaking around the fourth year after the shock. This effect remains from the fourth to the seventh year.
Figure 4: Response of inflation to log (oil income per capita)
How does corruption respond to a positive change in inflation following oil booms? Figure 5 shows that corruption significantly increases in the second year following a positive shock to inflation. This suggests that inflation, potentially driven by an oil boom, boosts reported corruption cases. Inflation can obscure pricing transparency, lead to invoice manipulation (Farzanegan 2009) and lower purchasing power, increasing incentives for corruption. Additionally, an inflationary environment may shorten the time horizons of individuals and policy-makers, reducing their focus on long-term impacts of corruption on development.
Potential mechanisms: military spending
In autocratic countries, increased oil revenues often boost military spending to protect the ruling regime, sometimes at the cost of public education and health services. In such systems, where elections have less impact, the military elite’s interests can overshadow those of the general population (Dizaji et al, 2016).
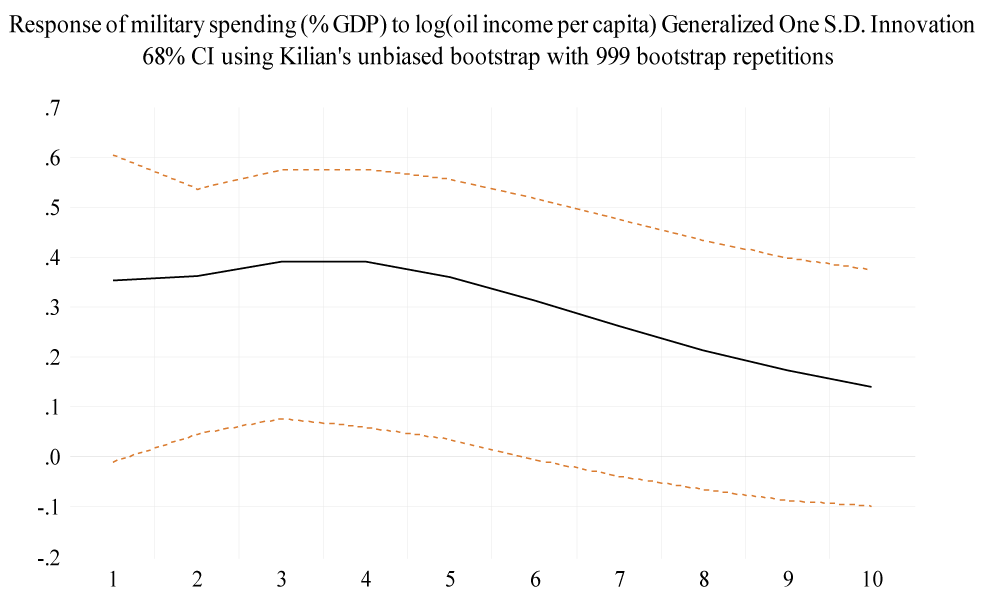
Figure 5 shows that military spending increases significantly in the first five years after an oil boom. How does corruption respond to this rise in military spending? The military sector’s lack of transparency, limited public access to contracts, and high potential for misinvoicing trade documents – especially for advanced equipment – create an environment ripe for corruption.
Figure 5: Response of military spending (as a percentage of GDP) to log (oil income per capita) shock
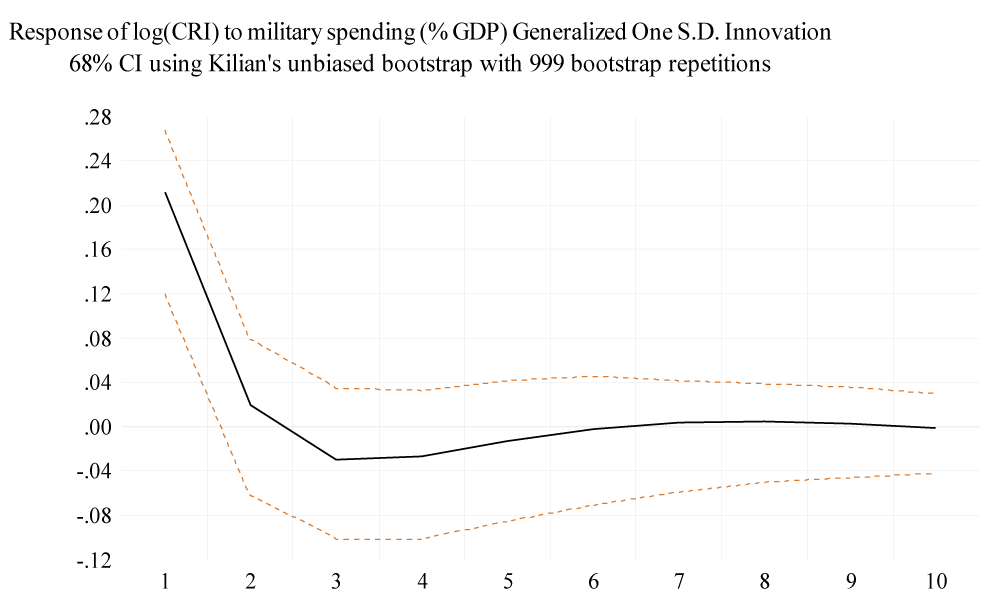
As expected, the CRI shows a significant and positive response within the first year following an increase in military spending (see Figure 6).
Figure 6: Response of log (CRI) to military spending (as a percentage of GDP) shock
Potential mechanisms: the quality of institutions
Rising oil rents and a reliance on them can undermine a state’s financial independence from citizens’ contributions, such as taxes, potentially weakening democratic institutions. Strong democratic institutions are vital for controlling corruption, as they support a free media, transparency and public engagement in politics. Without robust democratic structures, the risk of detecting corruption diminishes.
Figure 7 shows a significant negative response of the liberal democracy index to a positive shock to oil rents during the first four years.
Figure 7: Response of log (liberal democracy) to log (oil income per capita) shock
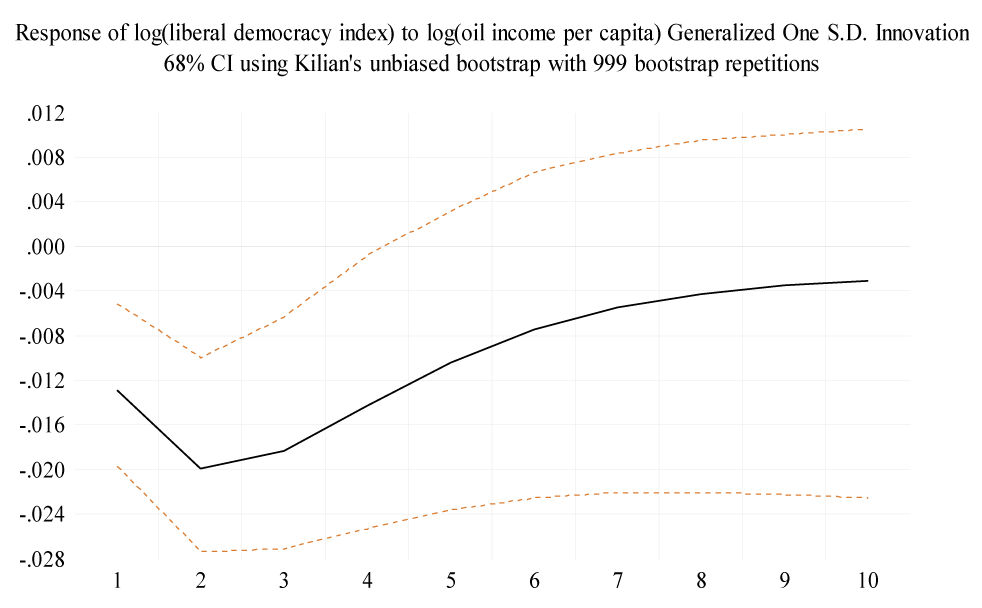
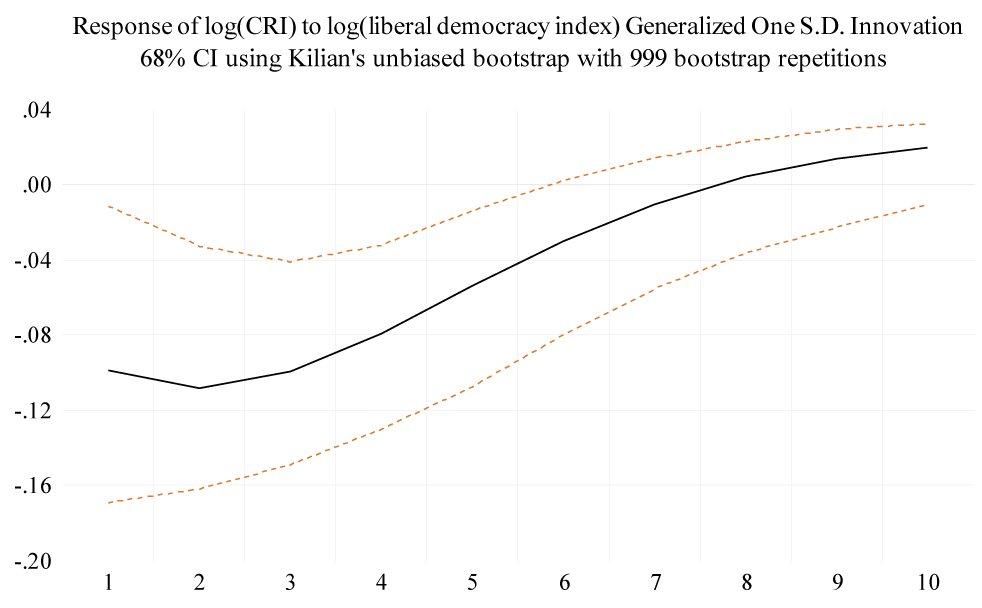
Figure 8 clearly shows that corruption decreases in response to an improvement in the quality of democratic institutions.
Figure 8: Response of log (CRI) to log (liberal democracy) shock
Conclusion
Our study explores the dynamic relationship between oil rents and corruption in Iran using data from the past 50 years. We analyse how fluctuations in oil rents affect corruption and identify the mechanisms through which these effects occur. Our key finding shows a significant increase in the corruption reflection index in the years after a positive shock to the country’s oil income per capita.
Further reading
Bjorvatn, K. and Farzanegan, M.R., 2013. Demographic Transition in Resource Rich Countries: A Blessing or a Curse? World Development, 45, 337–351.
Dincer, O. and Johnston, M., 2017. Political Culture and Corruption Issues in State Politics: A New Measure of Corruption Issues and a Test of Relationships to Political Culture. Publius, 47 (1), 131–148.
Dincer, O. and Teoman, O., 2019. Does corruption kill? Evidence from half a century infant mortality data. Social Science & Medicine, 232, 332–339.
Dizaji, S.F., Farzanegan, M.R., and Naghavi, A., 2016. Political institutions and government spending behavior: theory and evidence from Iran. International Tax and Public Finance, 23 (3), 522–549.
Farzanegan, M.R., 2009. Illegal trade in the Iranian economy: Evidence from a structural model. European Journal of Political Economy, 25 (4), 489–507.
Farzanegan, M.R. and Markwardt, G., 2009. The effects of oil price shocks on the Iranian economy. Energy Economics, 31 (1), 134–151.
Farzanegan, M.R. and Witthuhn, S., 2017. Corruption and political stability: Does the youth bulge matter? European Journal of Political Economy, 49, 47–70.
Farzanegan, M.R. and Zamani, R., 2024a. Oil rents shocks and corruption in Iran. Review of Development Economics, https://doi.org/10.1111/rode.13149.
Farzanegan, M.R. and Zamani, R., 2024b. The effect of corruption on internal conflict in Iran using newspaper coverage. Defence and Peace Economics, 35 (1), 24–43.
Gutmann, J., Padovano, F., and Voigt, S., 2020. Perception vs. experience: Explaining differences in corruption measures using microdata. European Journal of Political Economy, 65, 101925.
OPEC, 2023. Annual Statistical Bulletin 2022 [online].
Ross, M.L., 2012. The Oil Curse | Princeton University Press. Princeton, New Jersey: Princeton University Press.
Torvik, R., 2002. Natural resources, rent seeking and welfare. Journal of Development Economics, 67 (2), 455–470.
World Bank, 2023. Worldwide Governance Indicators.


