In a nutshell
Child stunting – an indicator of chronic malnutrition – has profound, long-term effects on health, cognitive development and economic productivity.
There has been a dramatic rise in both the incidence and severity of child stunting in Tunisia between 2018 and 2023 – a stark warning to the country’s policy-makers, which underscores the urgent need for targeted interventions to combat an escalating health crisis.
To reverse these alarming trends and safeguard the health and future of Tunisia’s next generation, it is imperative to invest in comprehensive, evidence-based nutrition and health programmes, enhance food security and ensure equitable access to healthcare services.
In the first two decades of the 21st century, there was a remarkable 32.5% reduction in the incidence of child stunting in Tunisia: from 12.3% among children aged under five in 2000 to 8.3% in 2018. That was the central finding of an analysis of the evolution of children’s health indicators based on data from the Multiple Indicator Cluster Surveys (MICS), which was presented in July 2024, at the Xème Congrès International Francophone d’Épidémiologie et Santé Publique (Neffati et al, 2024).
This decline marked a significant achievement, underscoring the importance of tackling child stunting to foster sustainable human development. Stunting, an indicator of chronic malnutrition, has profound, long-term effects on health, cognitive development and economic productivity.
Given these stakes, the release of the latest MICS data from 2023 has sparked renewed interest in examining whether these positive trends of reduced child stunting have continued or reversed. Here, I delve into the trends, focusing on their socio-economic distribution, to provide insights into how the incidence and severity of stunting have evolved among different socio-economic groups within Tunisia’s population.
A troubling trend: the rising incidence of stunting since 2018
To begin, we explore the incidence of stunting among the country’s under-five population, as reported by Neffati et al (2024). Children are defined as stunted if their height-for-age is more than two standard deviations below the World Health Organization’s Child Growth Standards median.
Figure 1 illustrates the incidence of stunting for 2012, 2018 and 2023, along with the confidence intervals for my estimates. The green ‘X’ marks shown for 2012 and 2018 correspond to the estimates provided by Neffati et al (2024).

Using the same dataset, I aimed to replicate their results. To match their results, it was necessary to assume a random survey design, giving equal weight to each observation. But because the MICS surveys employ a stratified sampling method based on the most recent census data (the 2014 census is used for the survey design for the 2018 and 2023 waves; and the 2004 census for the 2012 wave), I used weighted estimators to represent the national under-five population accurately.
The point estimates obtained for the incidence of stunting using survey weights are slightly lower than those reported by Neffati et al (2024), with 8.99% in 2012 and 7.99% in 2018. Despite minor discrepancies, the overall trend between 2012 and 2018 remains consistent across both studies. While there was a decrease in the incidence of stunting among children under five during this period, this change is not statistically significant due to overlapping confidence intervals.
But a dramatic shift occurred after 2018. By 2023, the incidence of stunting had surged to 12.01%, representing an increase of 50.31%. This alarming reversal in just five years has undone the progress achieved over the 18 years from 2000 to 2018.
Beyond incidence: a deeper dive into socio-economic inequalities
Looking solely at the incidence of child stunting does not sufficiently capture the issue’s complexity from a public health perspective. Following Wagstaff (2002), I employ a shortfall index approach to provide a more nuanced analysis.
A health shortfall index increases (decreases) with a rise (fall) in the average level of an ill-health variable. It also rises (falls) with an increase (decrease) in socio-economic inequality in its distribution. Wagstaff (2002) cautions that using a single shortfall index imposes a specific level of aversion to socio-economic health inequalities. To mitigate this, he suggests a parametric class of indices that allows for varying levels of inequality aversion.
In this study, I adopt the alternative approach proposed by Khaled et al (2018), which allows for considering all potential shortfall indices. They demonstrated that if the absolute health concentration curves of two distributions do not intersect, the distribution with the higher curve indicates a higher health shortfall for any chosen health shortfall index.
The absolute health concentration curve plots the cumulative proportion of a health variable, multiplied by its mean, against the cumulative proportion of the population ranked by socio-economic status to illustrate both socio-economic health inequality and overall health achievement or shortfall (for an ill-health variable). Khaled et al (2018) further showed that if the absolute health concentration curves of two distributions do not intersect, the curve above the other will yield a higher value for any rank-dependent shortfall index.
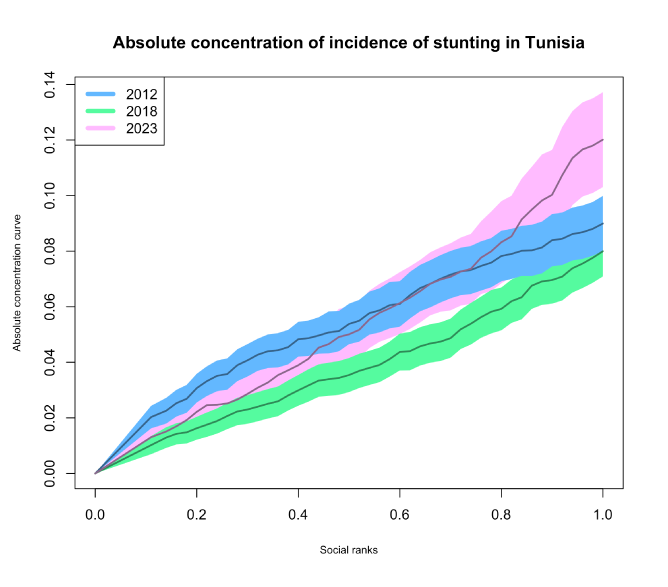
Figure 2 illustrates the absolute concentration curves for the incidence of stunting in Tunisia for 2012, 2018 and 2023, accompanied by their 95% confidence bands. These curves were estimated using the MICS surveys’ combined wealth score as a socio-economic status proxy. A quick visual inspection reveals a concerning pattern: the 2023 curve lies above the 2012 curve, where they significantly differ; and similarly, the 2012 curve is above the 2018 curve, where there are significant differences.

We applied the robust test developed by Khaled et al (2018) to validate the interpretation from this visual inspection. The results confirm our visual inspection: stunting shortfalls in 2023 are consistently greater than or equal to those in 2012; and 2012 shortfalls are greater than or equal to those in 2018. This troubling trend indicates that stunting rates in Tunisia are not just stagnating: they are worsening.
What this finding clearly implies is that regardless of one’s ethical stance or sensitivity to socio-economic health inequality, the ranking remains the same: the shortfall in the incidence of stunting is worse in 2023 than in 2012; and worse in 2012 than in 2018. This consistent ordering underscores that regardless of different ethical perspectives on socio-economic health inequality, the incidence of stunting has markedly worsened by 2023. The evidence is undeniable: the situation has deteriorated, demanding urgent attention and intervention.
Accounting for severity: a robustness check with an alternative stunting indicator
In research on obesity in the United States, Bilger et al (2017), underscored a fundamental limitation of using a simple binary incidence measure: it fails to capture variations in the severity of a health condition. To address this, they proposed an individual indicator that reflects the condition’s severity rather than just its presence.
Abu-Ismail et al(2020) adapted this recommendation specifically for child stunting, suggesting a modified stunting indicator that assigns a value of zero if a child is not stunted and, if stunted, a value equal to -2-zi, where zi is the height-for-age z-score of observation i. This indicator provides a more nuanced view of stunting severity.
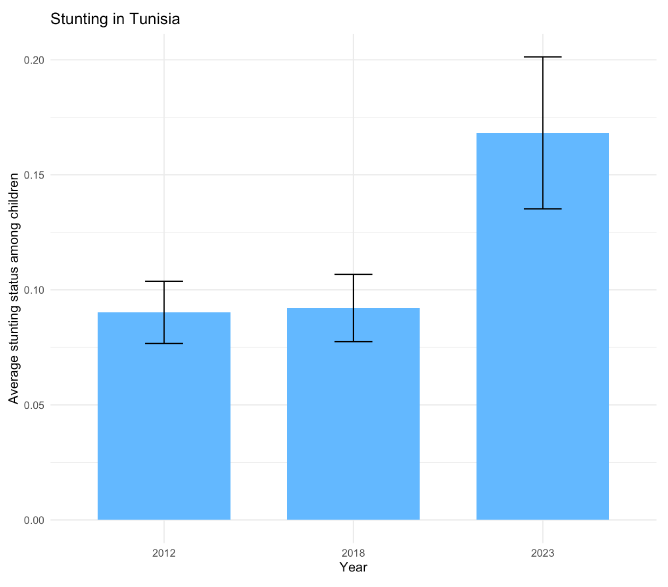
Figure 3 presents a bar chart of the average values of this modified stunting indicator for 2012, 2018 and 2023. The average value for 2012 is 0.0902, slightly lower than the 0.0921 for 2018, but the confidence intervals overlap, indicating no statistically significant difference between these two years. In stark contrast, the average for 2023 dramatically rises to 0.1682, a statistically significant increase of 82.6% from 2018, underscoring a marked deterioration in stunting severity.

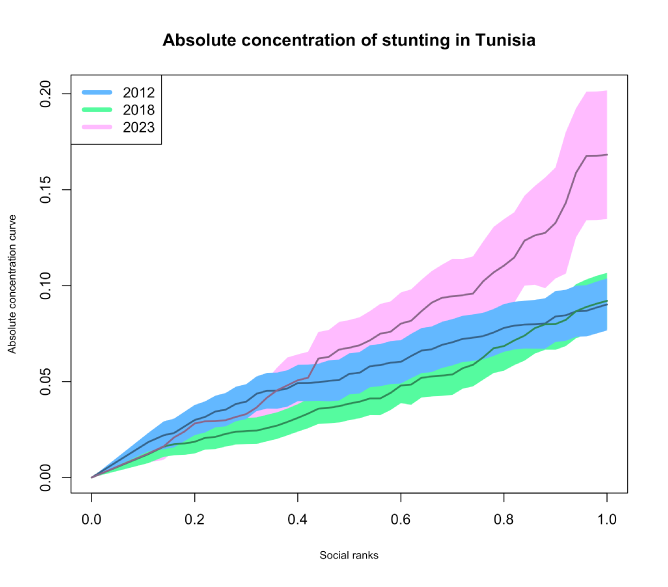
Figure 4 illustrates the absolute concentration curves for 2012, 2018 and 2023, constructed using this modified stunting indicator. The curves reveal that the 2023 curve is consistently above the 2012 curve, wherever they differ significantly; and the 2012 curve is above the 2018 curve, where significant differences are observed. This pattern is supported by the statistical test I implemented based on Khaled et al (2018).

This test results consistently show that for any shortfall index, the stunting shortfall in 2023 is higher than or equal to that in 2012; and the shortfall in 2012 is higher than or equal to that in 2018. The ranking between 2012 and 2018 has now become statistically significant, especially highlighted by the confidence bands in Figure 4, which do not overlap between the social ranks of 0.3 and 0.4, pointing to significantly greater socio-economic inequality in 2012 than in 2018.
The most crucial insight from these findings is the worsening situation in 2023 regarding both the incidence and severity of stunting, particularly among the most socio-economically disadvantaged groups.
Policy implications: urgent need for targeted interventions
The sharp increase in stunting from 2018 to 2023 is likely to be tied to Tunisia’s economic and political turbulence. The country faced economic challenges, including sluggish growth, high unemployment and rising inflation, all exacerbated by political developments and the Covid-19 pandemic. These factors may have strained public resources and disrupted essential services such as healthcare and nutrition programmes.
Since 2019, under President Kais Saied’s leadership, Tunisia has seen significant political changes, with moves that some perceive as consolidating executive power. This period of political uncertainty is likely to have hindered policy implementation, undermining efforts to address rising levels of food insecurity and child malnutrition. The worsening stunting rates during this time vividly illustrate how economic downturns and political instability can adversely affect public health, especially among the most vulnerable.
The incidence of child stunting in Tunisia has increased by more than 50% between 2018 and 2023. Our findings reveal an even more alarming trend: the average stunting severity, as measured by the indicator proposed by Abu-Ismail et al (2020), has surged by over 80% during the same period.
In addition, statistical tests based on Khaled et al (2018) indicate a worsening in both the prevalence and severity of malnutrition among children, regardless of one’s ethical stance on socio-economic inequality. The consistency of these results across various shortfall indices underscores the robustness of our analysis. The evidence is unequivocal: the nutritional health of Tunisia’s youngest citizens is rapidly deteriorating and requires immediate and decisive action.
These findings are a stark warning to Tunisian policy-makers. The dramatic rise in both the incidence and severity of child stunting from 2018 to 2023 underscores an urgent need for targeted interventions to combat this escalating health crisis. To reverse these alarming trends and safeguard the health and future of Tunisia’s next generation, it is imperative to invest in comprehensive, evidence-based nutrition and health programmes, enhance food security and ensure equitable access to healthcare services.
Further reading
Abu-Ismail, K, V Gantner, P Makdissi and M Yazbeck (2020) ‘Socioeconomic inequalities in child malnutrition in Egypt’, Metron 78: 175-91.
Bilger, M, EJ Kruger and EA Finkelstein (2017) ‘Measuring socioeconomic inequality in obesity, looking beyond the obesity threshold’, Health Economics 26: 1052-56.
Khaled, MA, P Makdissi and M Yazbeck (2018) ‘Income-related health transfers principles and orderings of joint distributions of income and health’, Journal of Health Economics 57: 315-31.
Neffati, A, H Bourguerra, W Gam, A Brayek and A Mrabet (2024) ‘Tendance de l’évolution des indicateurs de l’état de santé des enfants âgés de moins de 5 ans en Tunisie: revue des Multiple Indicator Cluster Survey (MICS) 2000-2018’, Journal of Epidemiology and Population Health 72 S3: 202689.
Wagstaff, A (2002) ‘Inequality aversion, health inequalities and health achievement’, Journal of Health Economics 21: 627-41.
The work has benefited from the comments of the Technical Experts Editorial Board (TEEB) of the Arab Development Portal (ADP) and from a financial grant provided by the AFESD and ADP partnership. The contents and recommendations do not necessarily reflect the views of the AFESD (on behalf of the Arab Coordination Group) nor the ERF.


