

In a nutshell
Small firms in Egypt report more constraints on their ability to do business than large firms; likewise, the relative priorities of business obstacles differ across the sectors or industries of business operation.
Policies geared towards eliminating or minimising the severity of business obstacles will have better outcomes if they target the group of firms that is more likely to report such obstacles.
The implementation of Egypt’s new investment law of 2017 is several steps in the right direction.
The World Bank’s Enterprise Surveys (WBES) are an important source of information about the business climate in countries, especially for identifying challenges to the creation of an attractive environment. There is a strong consensus from empirical research about the adverse effects of business obstacles on firms’ performance and economic growth more broadly.
My research on the 2016 survey of Egypt uses ‘network coincidence analysis’ (NCA) to provide new evidence on how firm-specific characteristics are closely tied to perceived business obstacles that matter the most for their needs. For example, growing firms place the shortage of skilled labour at the top of the list, whereas firms that are contracting find labour regulations most challenging.
As I indicate below, variations are strikingly marked along regional business distribution, managers’ education, market orientation and industry type. Policies geared towards eliminating or minimising the severity of business obstacles will have better outcomes if they target the group of firms that is more likely to report such obstacles.
Data and analysis
The empirical evidence is based on analysis of 1,478 establishments surveyed in 2016. The survey excludes all state-owned enterprises, and considers only major cities in Egypt. The surveys also pre-screen firms to ensure that they work in services or manufacturing, purposefully omitting all agricultural sector businesses.
Only top managers and owners are surveyed, ignoring the opinions of employees on firm performance and the business environment. (See Giovanis and Ozdamar, 2018, and Martinez-Zarzoso et al, 2018, for a detailed description of the sampling methodology.)
I use one of the standard questions in WBES: Q. ‘which of the elements of the business environment included in the list, if any, currently represents the biggest obstacle faced by this establishment’. Presented with 15 different obstacles, respondents are asked to rank the most challenging obstacles to doing business.
Excluding political instability, which is the response most reported at the top of the list, Figure A shows firms’ rank of the biggest obstacles to their business operation in 2016. Finance, electricity and tax rates are the top three on the list.
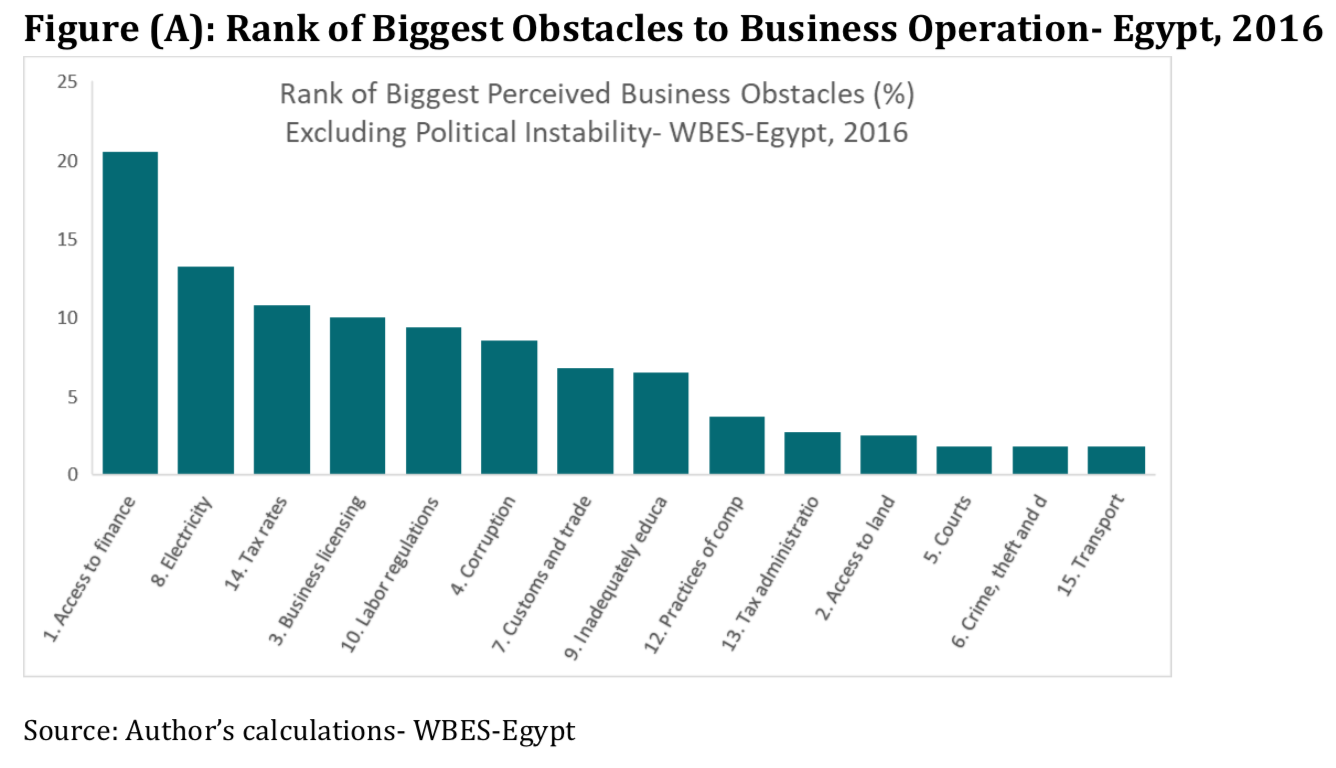 These aggregates conceal significant disparities among firms’ varying characteristics. For example, small firms (those employing up to 19 workers) are expected to report more constraints than large firms (those employing 100 or more workers). Likewise, the relative priorities of business obstacles differ across the sectors or industries of business operation.
NCA is ideal for analysing questions with multiple responses, especially when the respondent is presented with 15 different options. In addition to finding hidden patterns and associations among these responses, NCA identifies attributes that tend to appear jointly within groups of observations. More importantly, NCA provides ‘network graphs’ exposing similarities (or differences) between coincidental responses, and how (or if) they relate to clusters of observations.
Differences by region of business operation
Figure 1 shows regional differences in perceived business obstacles. The graph identifies three regions: Greater Cairo (38%); West, Middle and East Delta and Suez (41%): and North and South Upper Egypt and the Frontiers (21%).
Circles represent business obstacles with a size proportional to their frequencies. Regions are shown in squares. In addition, correlated obstacles appear closer to each other to express common characteristics among them. Lone obstacles mean that they are different or not related. Obstacles that coincide across different regions are connected together.
A coincidence would be defined when two obstacles are present at least once in a region. A pair of obstacles would likely be coincident if their frequency of co-appearance in the region is greater than if both obstacles were independent. For example, if corruption has appeared in 20 out of 100 times in Upper Egypt, and access to finance has appeared in 35 times, then both obstacles are not independent if they co-appeared together in Upper Egypt, suggesting corruption and access to finance are closely linked in Upper Egypt.
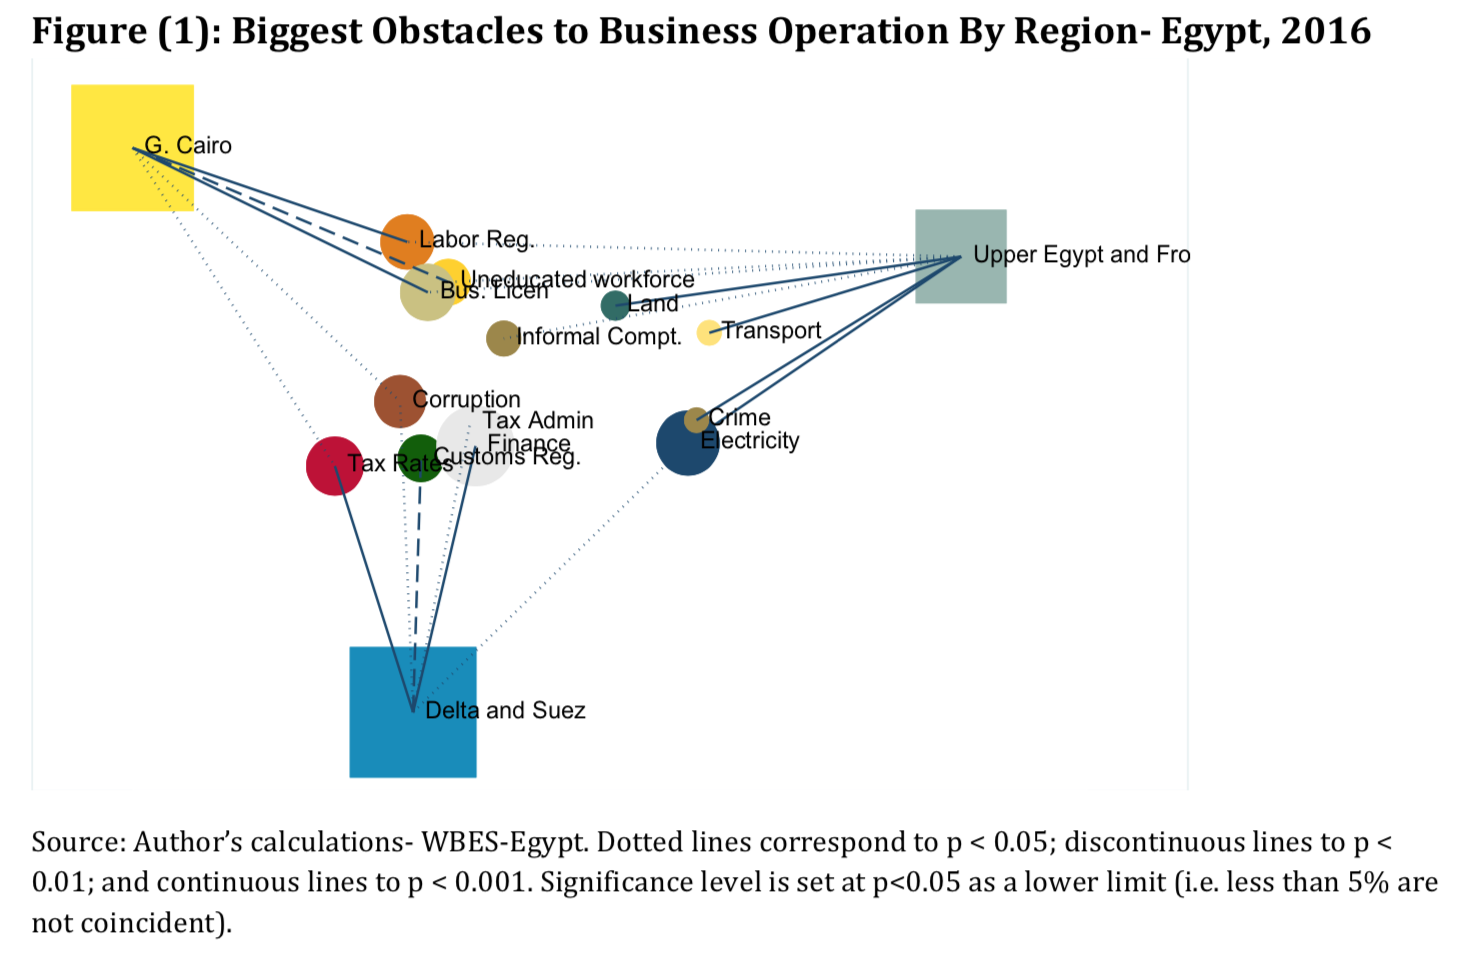 Figure 1 clearly reflects region-specific business obstacles. Historically less developed than the rest of Egypt, the Upper Egypt and Frontier governorates are burdened with power outages and an inefficient system of transport. Crime appears to be highly correlated with power outages as well. It is worth mentioning that the majority of businesses in these regions are small firms.
Businesses in the Delta and Suez governorates report constraints related to customs and tax. This is no surprise since over 54% of export-oriented firms operate from these regions. Finally, since over 25% of contracting businesses reside in Greater Cairo, it is no surprise to find that labour regulations and business licensing define challenges facing businesses in Greater Cairo.
Figure 1 also shows shared obstacles among regions. Corruption is a shared concern between Greater Cairo and Delta businesses alike, while power outage is a common problem among businesses in Delta and Suez and those in Upper Egypt.
Differences by market orientation
In addition to regional differences in perceived business obstacles, firms selling locally face distinctly different obstacles and constraints than those with national and international market orientation. In Figure 2, circles represent business obstacles with a size proportional to their frequencies. Locally versus nationally and internationally oriented firms are shown in squares.
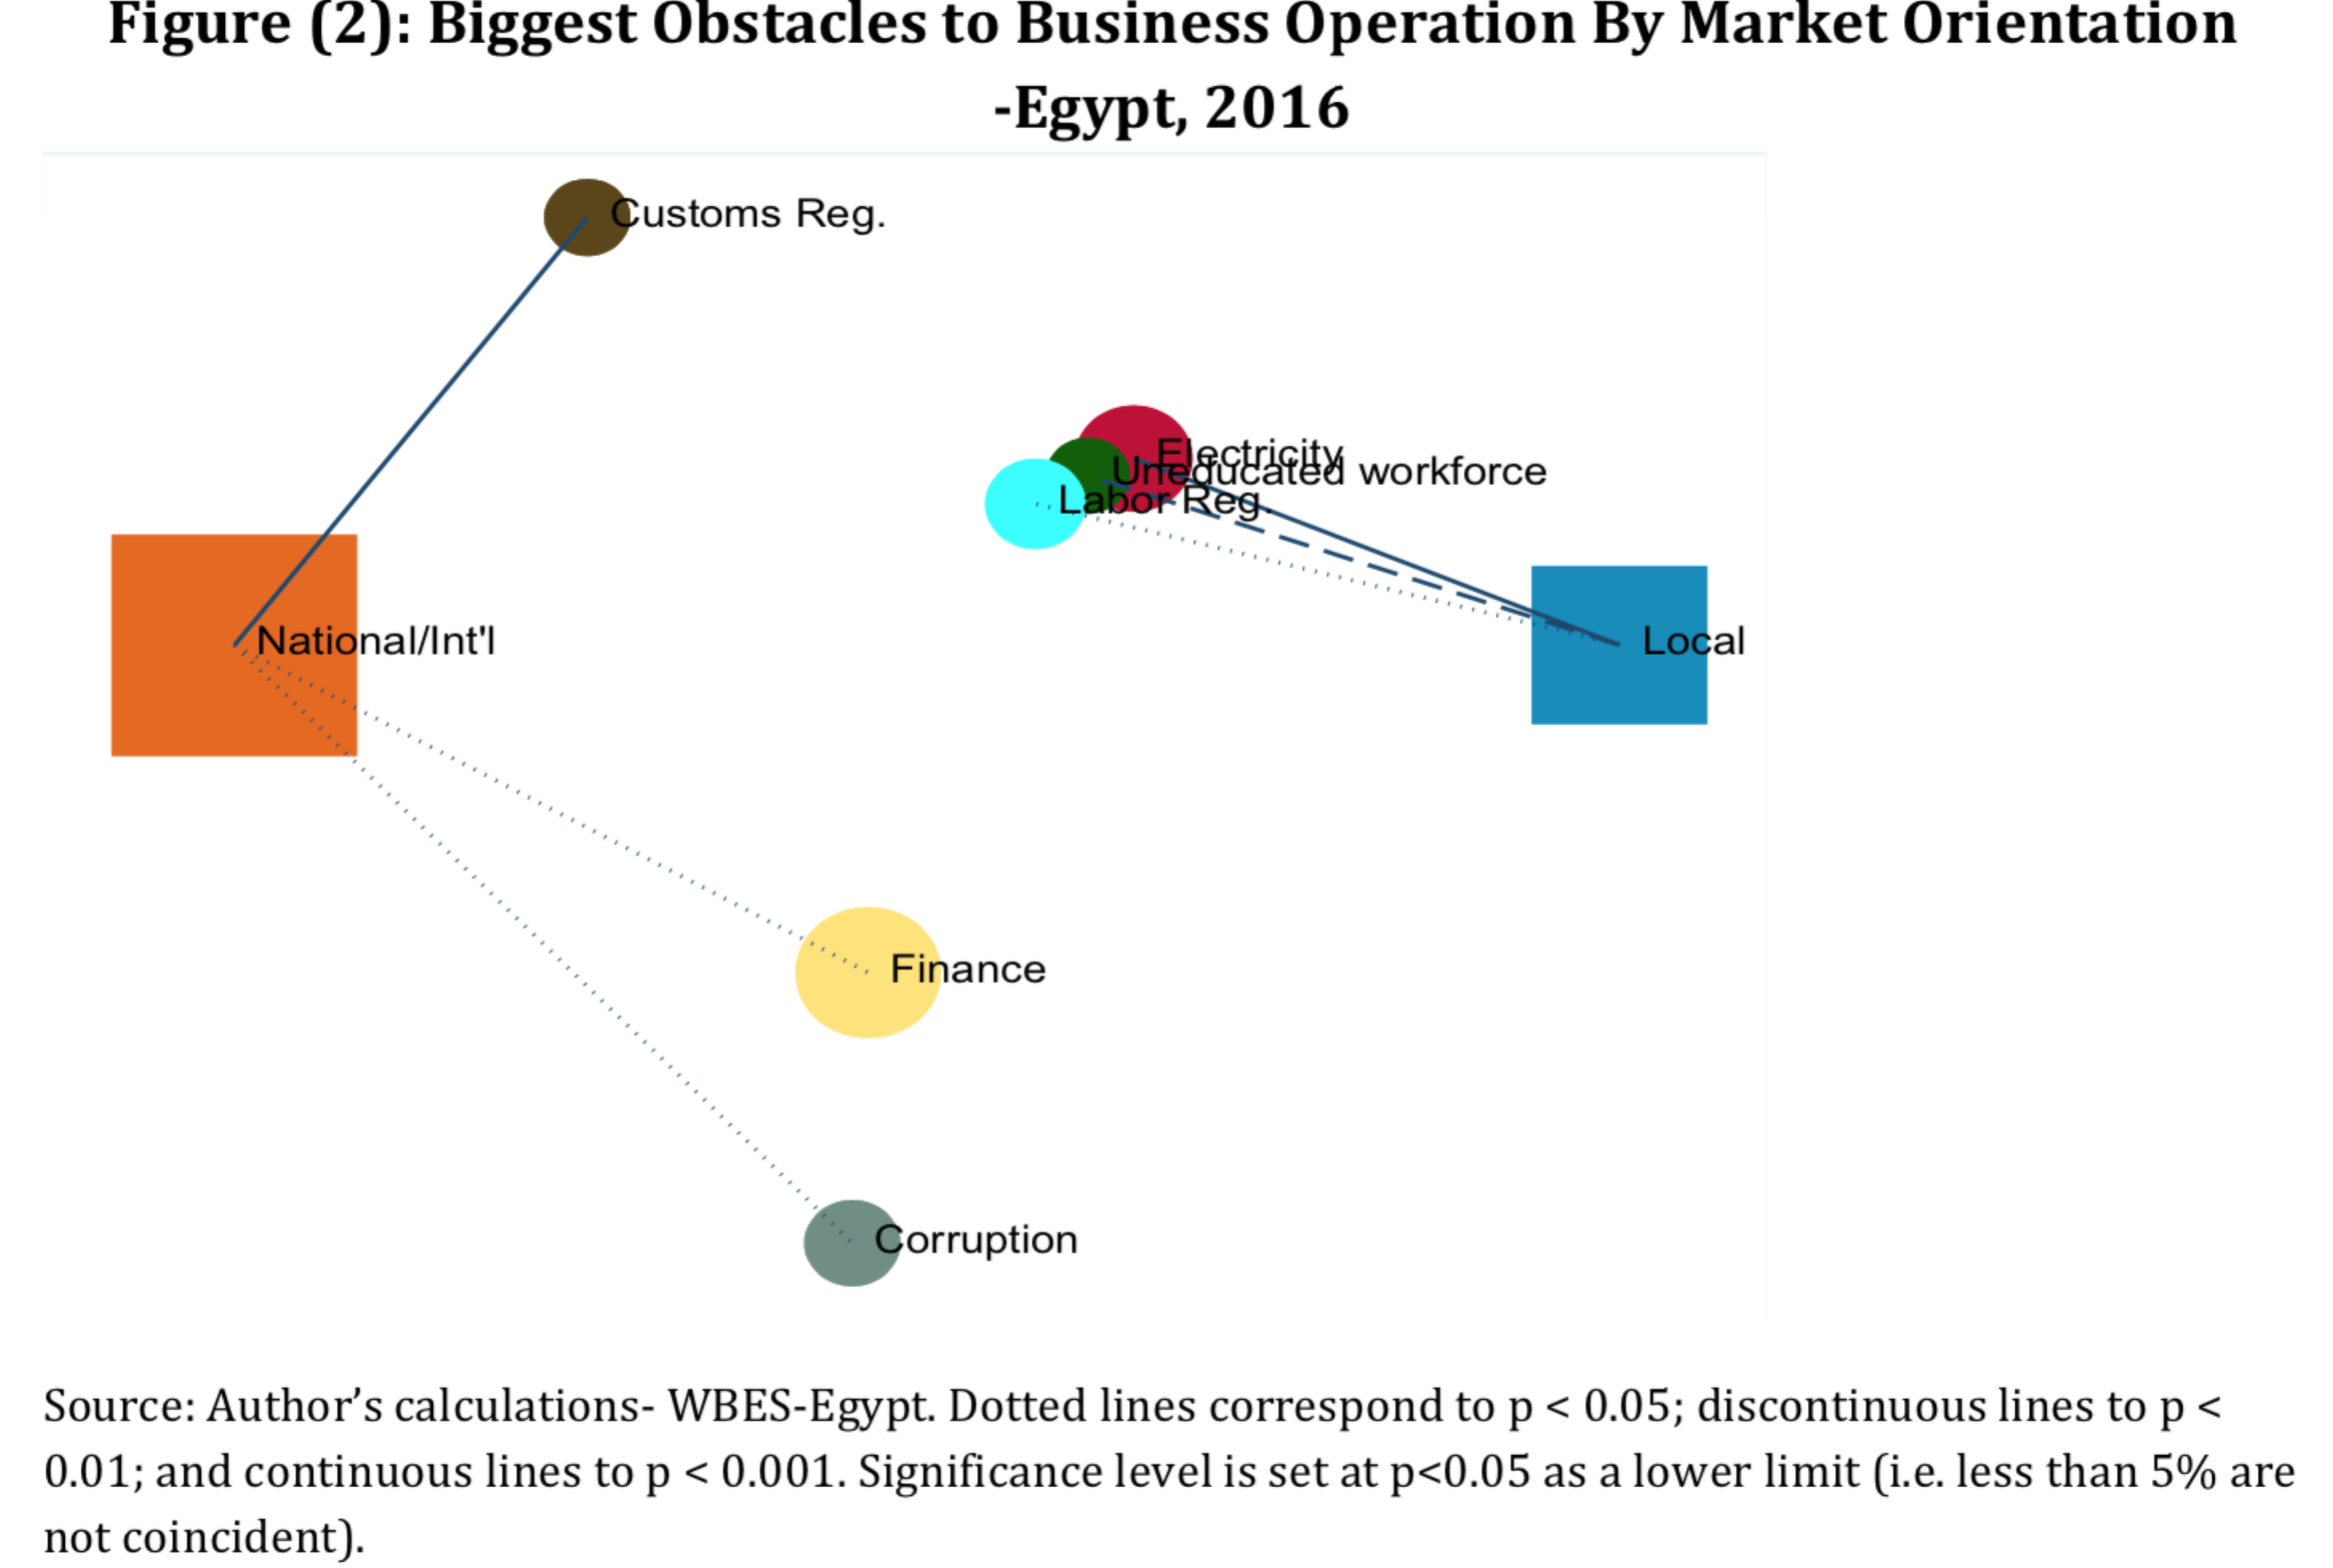
Figure 2 reveals businesses with national or international market orientations are severely constraint by customs regulations, finance and corruption. Inward-oriented businesses on the other hand report labour regulations and power outages as the biggest obstacles. This is probably due to the fact that most locally market-oriented firms are small, which disproportionately operate in economically disadvantaged regions (Upper Egypt and the Frontiers).
Differences by managers’ education
Education is a decisive component in perceived business obstacles. In Figure 3, perception of managers with college education are compared to those with less than college education (in squares), business obstacles are shown in circles.
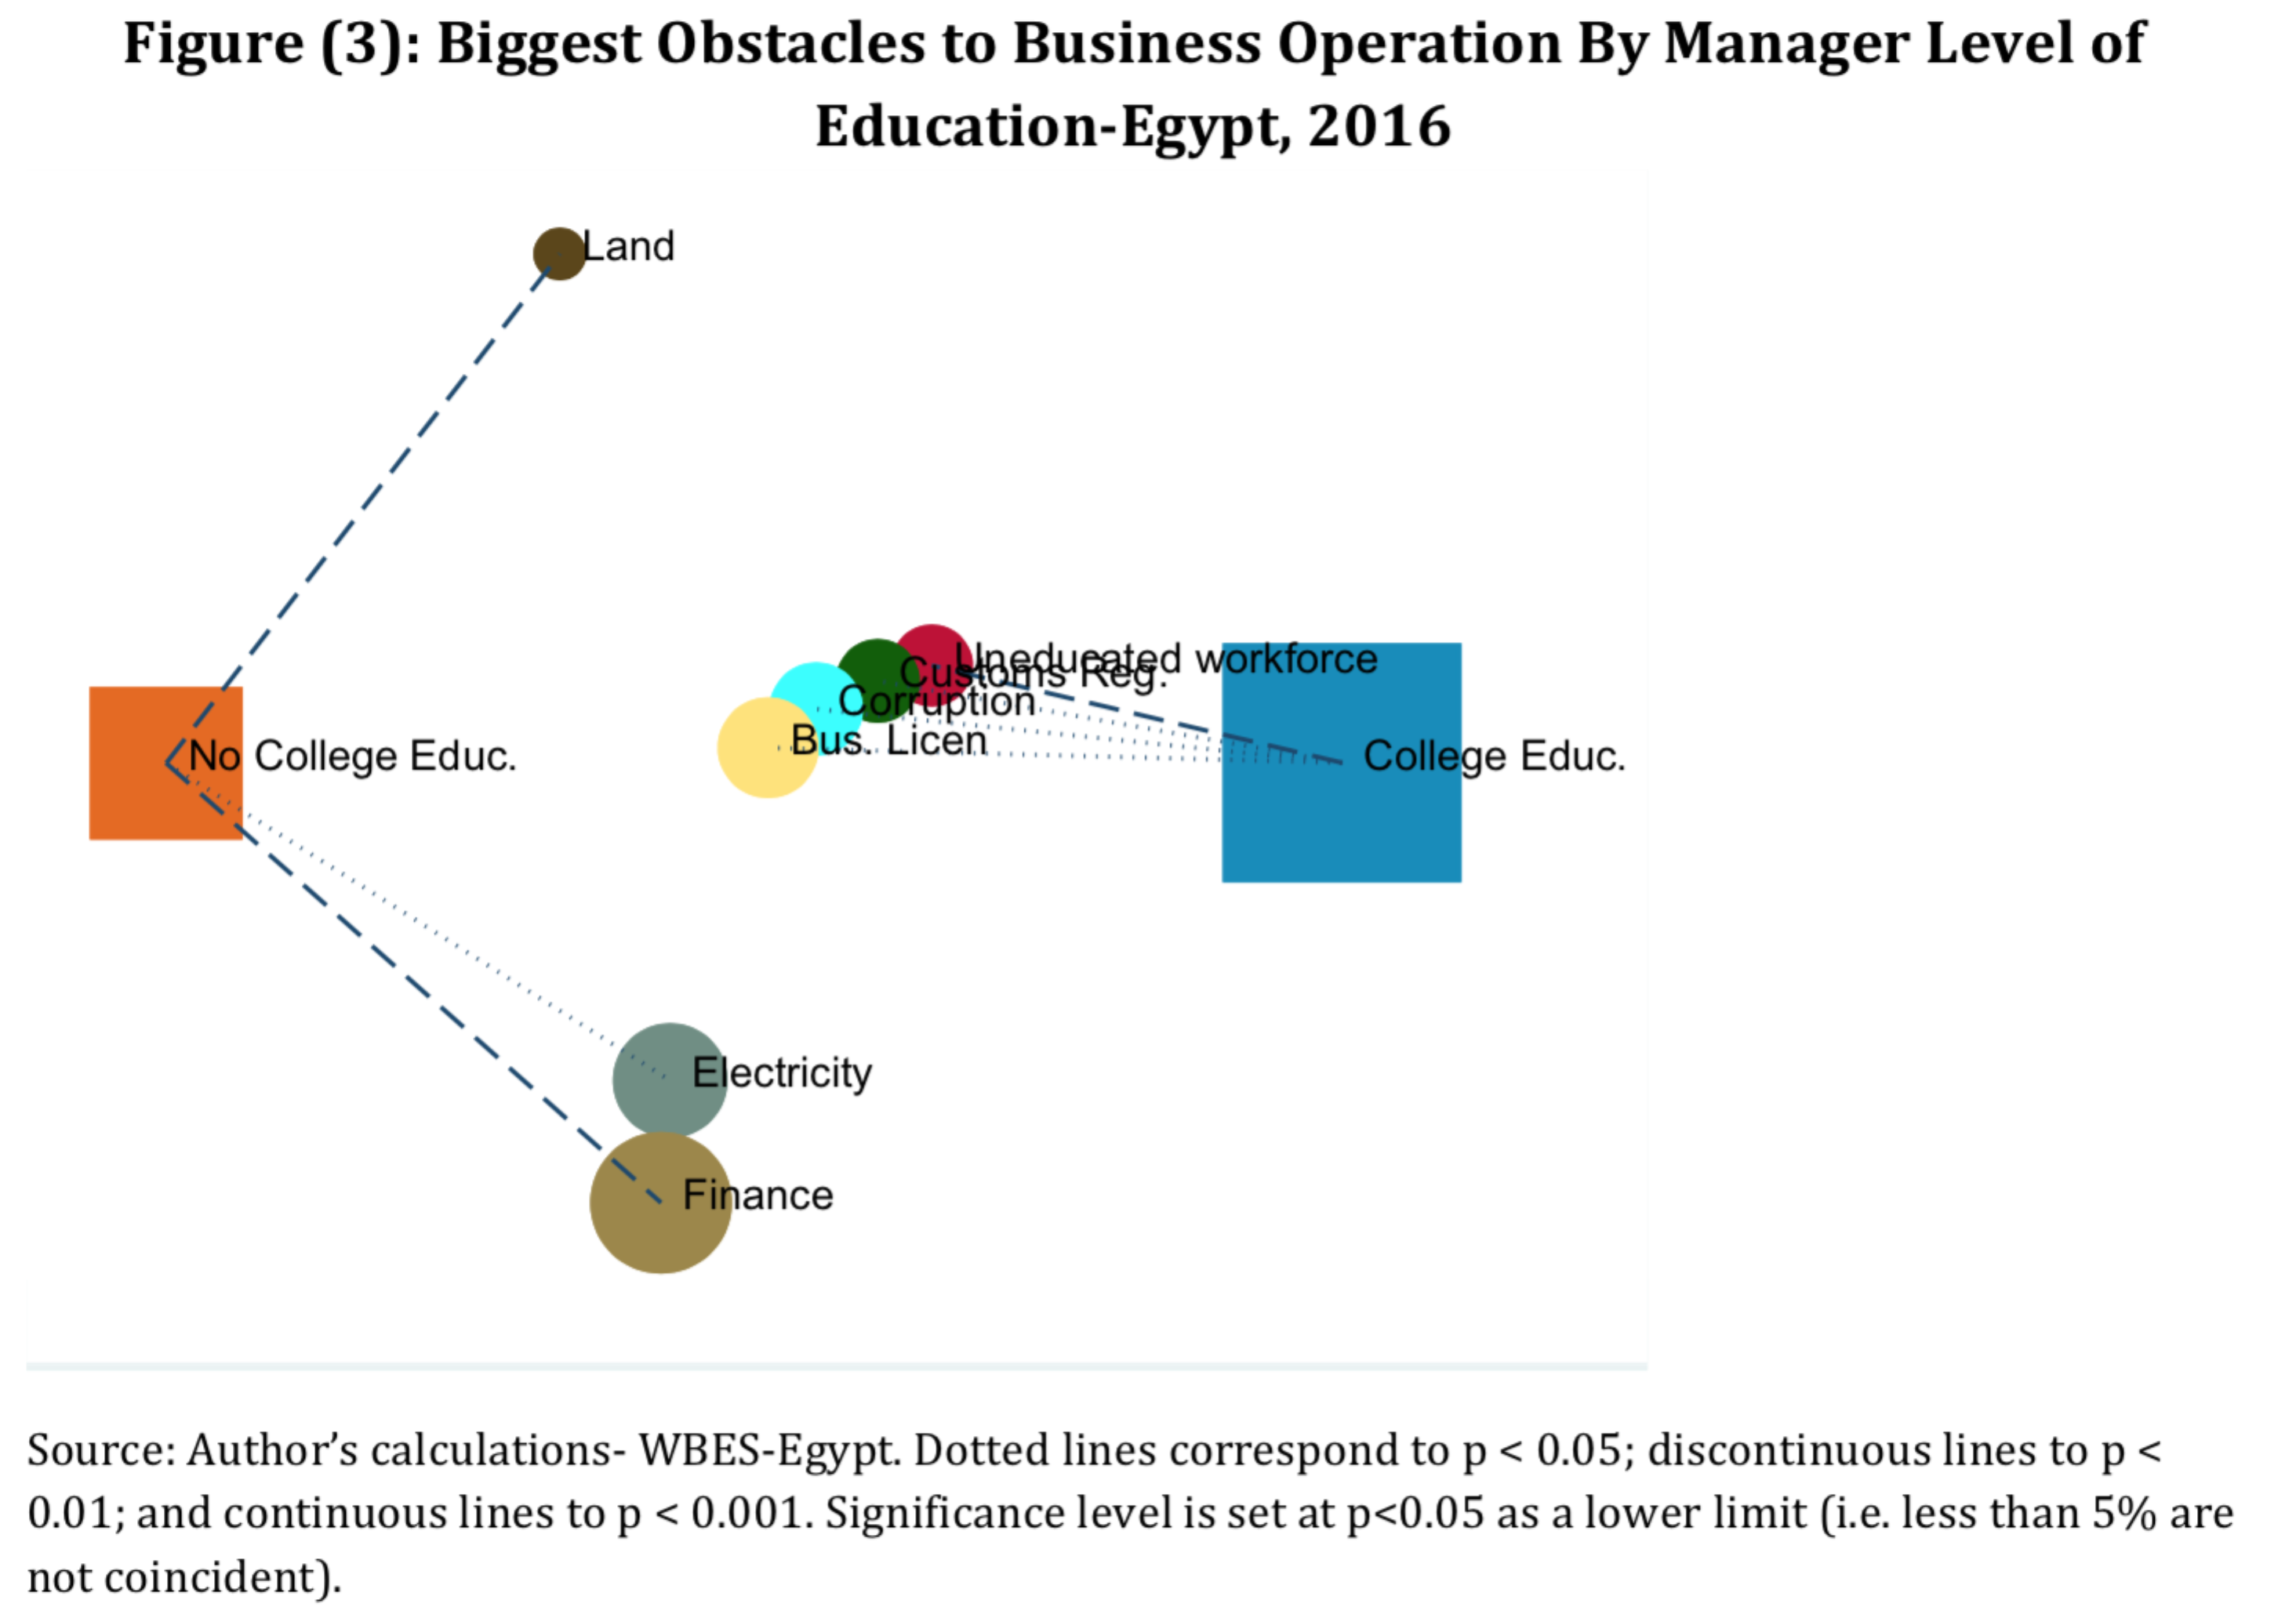 Figure 3 shows how closely related business obstacles are to managers with college education. They report the shortage of a skilled workforce, business licensing, corruption and customs regulations as jointly intertwined, with lack of skilled labour as the most significant.
It is noteworthy that access to finance is not on the list of the most significant constraints for this group of managers. Presumably higher educated managers have sufficient knowledge to identify varying sources of finances, to realise the complicated process of business loans and to explore further options. This may explain why close to 90% of firms reporting having a loan or a line of credit from a financial institution are owned or managed by a college-educated entrepreneur.
Differences by manufacturing industries
With manufacturing activities leading 64% of all businesses in 2016, it is important to distinguish between the business challenges of different industries. In Figure 4, the top three industries are shown in squares: Chemicals and Plastic (53%); Food and Tobacco (18%); and Textile and Leather (19%). Business obstacles are shown in circles.
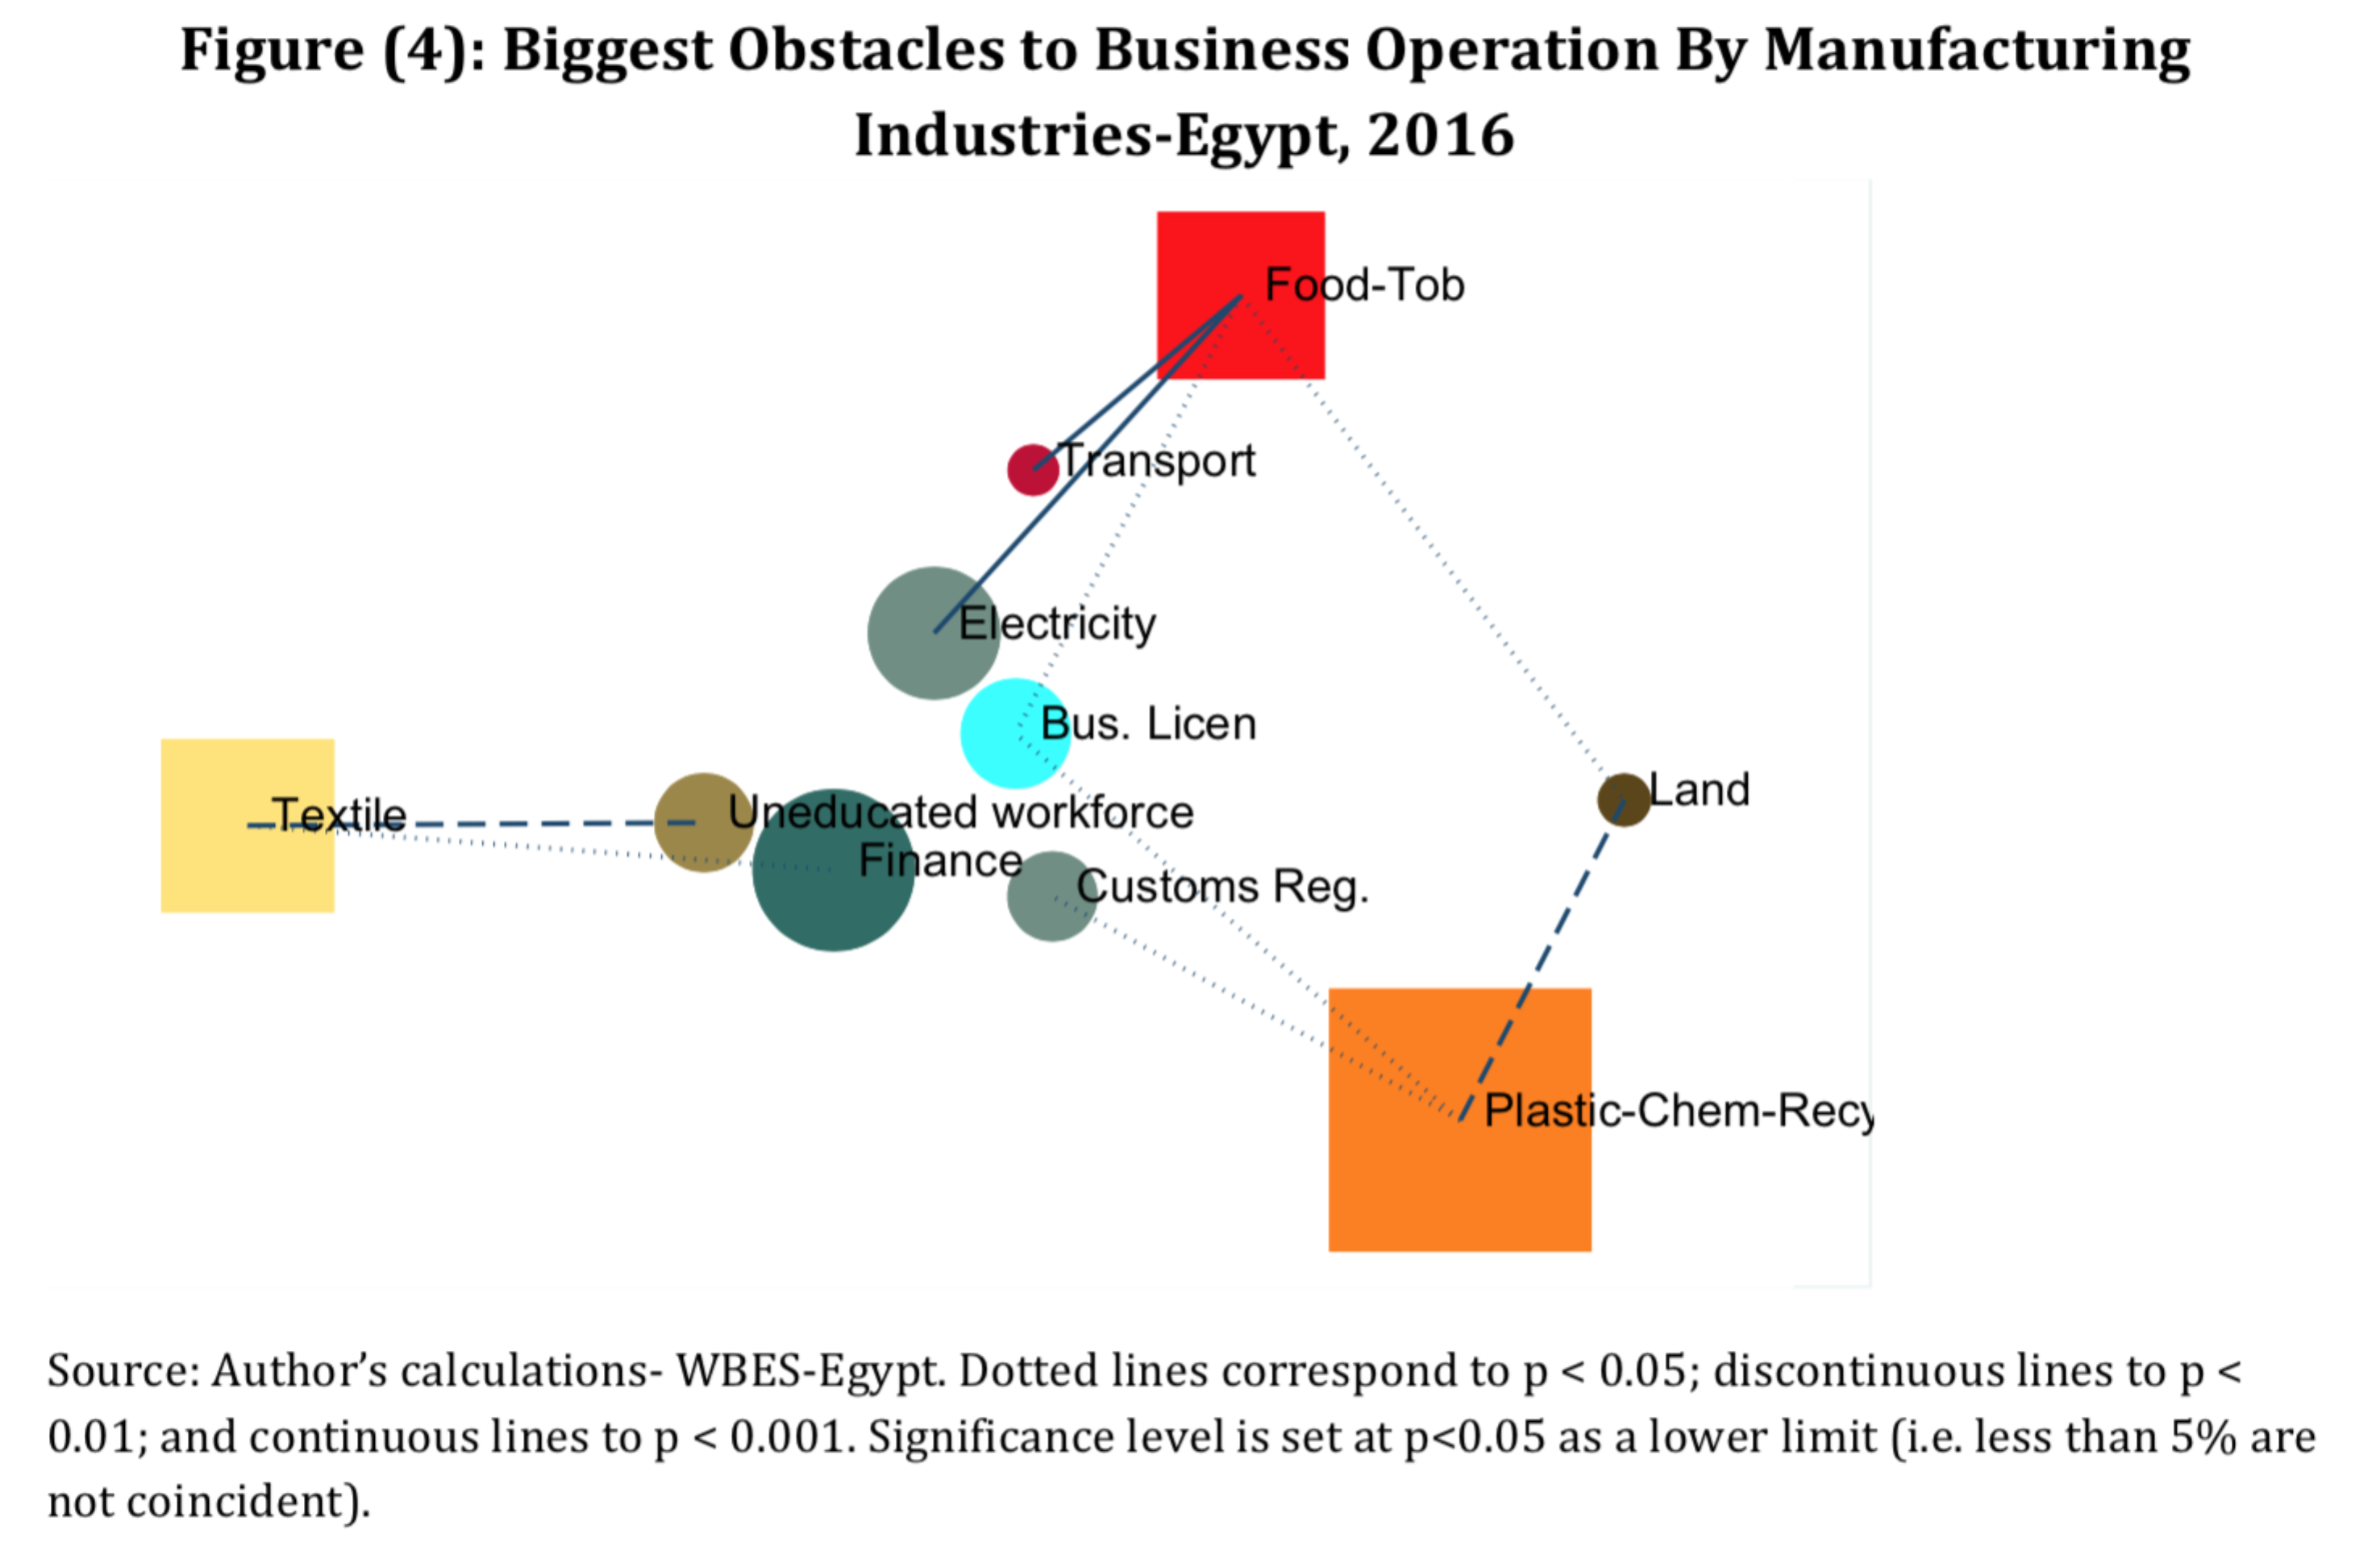 As might be expected, the chemical industry does not report access to finance as a major obstacle, since most businesses are medium to large in size and therefore presumably financially secure. Instead, access to land is the top impediment to growth. Considering that almost 50% of food and tobacco industries operate from the least economically advantaged regions (Upper Egypt and Frontiers), it is not surprising to find power outages and transport on top of the list of business obstacles. This last point calls for urgent action from the government to protect such a strategic industry.
Conclusion
My research provides evidence on the uniqueness of business obstacles and relative priorities according to firms’ specific attributes. Using NCA is a new way to analyse questions with multiple responses that help to unravel hidden connections, gain actionable insights, and plan definitive and targeted policies.
The implementation of Egypt’s new investment law of 2017 is several steps in the right direction. Under the new investment law, investors have the right to import raw materials, equipment, spare parts and/or transport means directly and as necessary for investment projects without registering with the Importers Registry, which can help to reduce start-up costs. This provides relief to businesses raising concerns about custom regulations in the Delta and Suez regions, along with firms in the chemical-plastic industry.
The application of a unified custom duty at a flat rate of only 2% of the value of any equipment, machinery and devices that are necessary for the establishment of infrastructure and investment projects is a positive boost to firms reporting power outage and transport on top of their list of significant business obstacles.
Further reading
Giovanis, Eleftherios and Ozdamar, Oznur (2018) ‘State Business Relations and the Dynamics of Job Flows in Egypt and Turkey’, ERF Working Paper No. 1271.
Grazzi, Matteo, and Carlo Pietrobelli (eds) (2016) Firm Innovation and Productivity in Latin America and the Caribbean: The engine of economic development, Inter-American Development Bank
Hallward-Driemeier, Mary, and Reyes Aterido (2009) ‘Comparing Apples with… Apples: How to make (more) sense of subjective rankings of constraints to business’, World Bank Policy Research Working Paper No. 5054.
Kresic, Ana, Jakov Milatovic and Peter Sanfey (2017) ‘Firm Performance and Obstacles to Doing Business in the Western Balkans: Evidence from the BEEPS’, EBRD Working Paper No. 200.
Martinez-Zarzoso, Inmaculada, Mona Said and Chahir Zaki (2018) ‘Trade Policy and Input Liberalization: The Effect on Egyptian Firms’ Productivity’, ERF Working Paper No. 1238.
Seker, Murat, and Paulo Guilherme Correa (2010) ‘Obstacles to Growth for Small and Medium Enterprises in Turkey’, World Bank Policy Research Working Paper No. 5323.