In a nutshell
Improved social outcomes for young people but without commensurate progress in their economic welfare or opportunities fosters a strong sense of economic and social injustice.
The combination of economic inequality and high levels of inequality in personal autonomy creates an inequality trap, in which governance frameworks and their ensuing economic and social policies lead to socio-economic arrangements that systematically favour the interests of those with more influence.
Policy measures needed to address this trap cannot be short-term or unidimensional: what is required is a new long-term development model with economic and social justice and core governance reforms at its heart.
Rethinking Inequality in Arab Countries is a forthcoming report from the United Nations Economic and Social Commission for Western Asia (ESCWA) and ERF. Here we summarise some of the main findings, which collectively indicate that the region is caught in an inequality trap.
On the economic policy front, trends such as low growth in household income, stagnating poverty, a squeezed middle class, low productivity and high informal employment suggest much higher levels of income inequality than are reported by expenditure-based Gini coefficients.
Social inequalities, though declining in outcomes due to rapid progress in basic education and health indicators, are rising in many indicators in terms of opportunities. These trends imply improved social outcomes, especially for youth. But without commensurate progress in their economic welfare or in the equality of opportunities they have, there is a strong sense of economic and social injustice.
These results, when combined with high levels of inequality in personal autonomy (and along with it the restricted space for voice and accountability), create an inequality trap in which governance frameworks and their ensuing economic and social policies lead to socio-economic arrangements that systematically favour the interests of those with more influence.
Policy measures needed to address this trap cannot be short-term or unidimensional. What is required is a new long-term development model with economic and social justice and core governance reforms at its heart.
Main findings
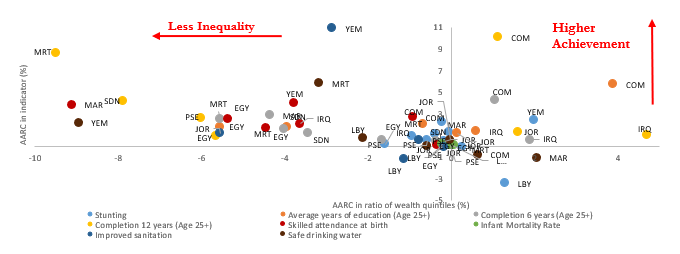
First, inequality outcomes and opportunity inequalities in social indicators are not moving in tandem. Thus, although there is a notable decline in outcome inequalities along with rapid progress since the early 2000s (see Figure 1), inequality of opportunities has increased for many of these social indicators, implying that the share of factors that lie beyond the control of youth (family wealth, their parents’ level of education, location, gender, etc.) play a more important role in determining these outcomes (see Figure 2).
Figure 1: Average annual rate of change (AARC) in selected indicators and their wealth ratio
Source: Authors calculations based on household surveys (MICS, DHS and PAPFAM)
Note that for all indicators, we set -10% and 10% as lower and upper bounds for the average annual rate of changes (AARC) in the ratio of richest to poorest quintiles. Generally, AARC values for all countries fall within this range, except for the following cases: Palestine and Sudan for safe drinking water; and Mauritania and Morocco for improved sanitation.
Figure 2: Average annual rate of change (AARC) in selected indicator and their dissimilarity index
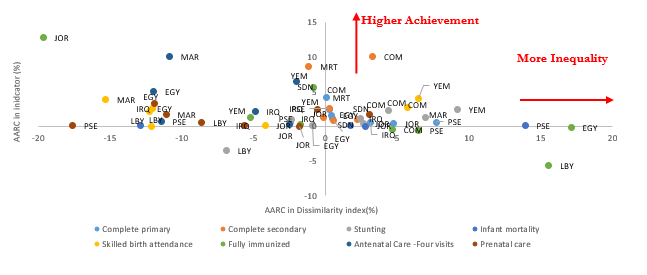
Source: Authors’ calculations based on household surveys (MICS, DHS and PAPFAM)
Table 1: Selected basic health and education indicators, population weighted average for richest and poorest quintiles
| Earliest survey (closest to 2000) | Latest survey (closest to 2018) | |||||
| Total popn | Poorest quintile | Richest quintile | Total popn | Poorest quintile | Richest quintile | |
| Stunting (%) | 31% | 38% | 21% | 26% | 32% | 20% |
| Infant mortality (per 1000 live births) | 48.5 | 66.3 | 27.0 | 24.1 | 33.2 | 15.0 |
| Skilled birth attendance (%) | 65% | 41% | 91% | 86% | 75% | 97% |
| Youth primary completion (%) | 63% | 38% | 85% | 78% | 62% | 94% |
| Youth secondary completion (%) | 22% | 7% | 48% | 40% | 24% | 67% |
Source: Authors’ calculations based on household surveys (MICS, DHS and PAPFAM)
Note: Group average reflects that for countries with two points and wealth index for both periods.
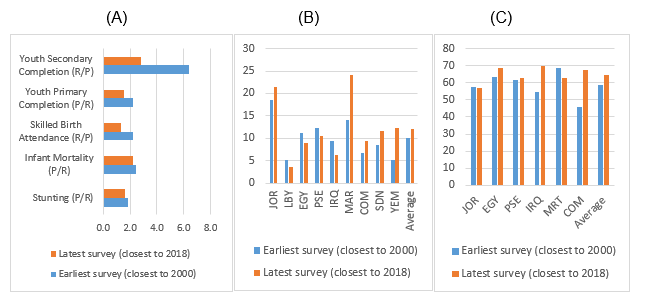
Figure 3: (A) Ratio of health and education group averages for richest and poorest quintiles and dissimilarity index (%) for (B) stunting and (C) secondary completion
Source: Authors’ calculations based on household surveys (MICS, DHS and PAPFAM)
As shown in Table 1 and Figures 3 A-C, improvements in reducing health deprivations and increasing educational achievements are evident across all indicators and for both quintiles. But progress narratives differed significantly. In the case of infant mortality, for example, progress was staggering and equally shared by rich and poor. In primary and secondary completion, progress was more impressive for the poorest quintile, nearly doubling for the former and more than tripling for the latter (from 7% to 24%).
The results of the dissimilarity index suggest an opposite trend. For stunting, the value of the index was low, indicating that circumstances such as wealth, head of household education level, gender, location, etc. play a relatively minor role in determining inequality outcomes. Still, the group average increased slightly from 10% to 12%. More importantly, the inequality in opportunities in secondary completion appears to be significantly higher and has increased to reach 65% in the latest year. This paradoxical result should invite some analysis and policy considerations.
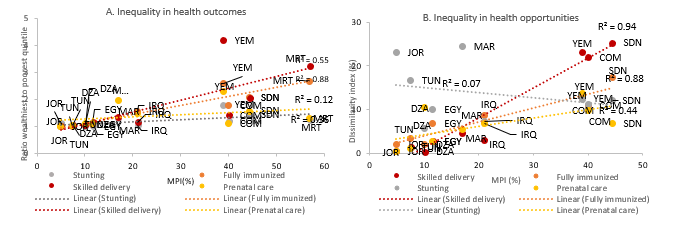
Second, poorer countries bear a double burden of higher inequalities and deprivation. Using the Arab multidimensional poverty index developed by ESCWA (2017), we find that generally, Arab countries with a higher level of multidimensional poverty, particularly the least developed countries, tend also to have higher levels of inequality of both outcomes and opportunities (see Figure 4). This association is conspicuous for certain health indicators, such as full immunisation of children and skilled birth attendance.
Figure 4: Multidimensional poverty and inequalities in health
Source: Authors’ calculations based on household surveys (MICS, DHS and PAPFAM) and ESCWA, UNICEF, OPHI and LAS (2017)
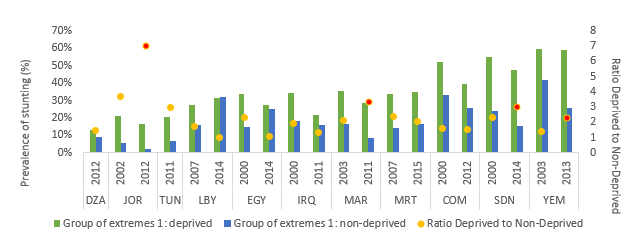
Third, across all countries, overlapping structural inequalities still run deep (such as between rich households with highly educated household heads and poor households with uneducated household heads). Inequality gaps between these extreme groups have also widened considerably in some countries, such as Jordan, Morocco, Sudan and Yemen, indicating that progress is not adequately reaching the most vulnerable groups (see Figure 5).
Figure 5: Prevalence of stunting, by groups of extremes
Source: Authors’ calculations based on household surveys (MICS, DHS and PAPFAM)
Fourth, inequalities of income and wealth have increased perceptibly (in real terms and not only in the realm of perceptions, as some would argue). Conventional measures of inequality such as the Gini coefficient derived from household surveys largely fail to capture the total income distribution, in particular those at the top percentile.
An alternative measure corrects for this omission by combining data from household expenditure surveys with other sources such as national income, wealth accounts and fiscal data from taxes on income. Using this approach, the World Inequality Database estimates that 64% of pre-tax national income in the region is captured by the top 10% earners, while the middle 40% and bottom 50% of population capture less than 30% and 10% of the national income, respectively. This regional inequality average, which is the highest worldwide, is not confined to oil-rich countries.
Fifth, the growth story for households is less rosy than for the economy as a whole, and the gap between national and household income is largest for the middle human development group of countries, particularly for Egypt and Morocco. For the former, the data reveal that the surveyed households have witnessed growth of less than 20% in their real income over a period of 25 years while the economy as a whole grew by more than 70%.
With the exception of two countries (Mauritania and Sudan) households’ incomes have been generally stagnant and the already wide gaps with GNI per capita have persistently widened over time. The policy-relevant conclusion is that increases in national incomes are not systematically transmitted to higher households’ income, thus delinking the growth process with its social impact and producing contradictory narratives for inequality.
Figure 6: Population distribution across poor to affluent economic groups in Egypt using national definitions 2005-2018
Source: Estimated based on Abu-Ismail and Sarangi (2015) and CAMPAS (2019).
Sixth, when harmonised national expenditure data are used, the economic pressures on the poor and middle class is more intense. According to ESCWA (2015), up to 2010, the middle class constituted nearly half of the population of nine Arab countries (47.3%). The population weighted regional average for poverty was 21%. An additional 20% of the population were vulnerable. This left an average of 12% of the population in the affluent category.
But much has changed in the region since 2010. The conflicts in Iraq, Syria and Yemen are projected to have increased poverty. Egypt, the largest Arab country, has also recorded a rise in its national poverty and vulnerability rates from 2010 to 2018 as a result of economic reform-related pressures on household income (see Figure 6).
As a consequence, there may have been a significant decline in the region-wide size of the middle class to a level of below 40% of the population in these countries. Likewise, poverty rates are likely to have exceeded 25% of the population.
Policy conclusions
Let’s start with the good news: over the past two decades, inequalities in health and education outcomes have generally declined along with improvements in basic development indicators such as stunting, primary and secondary education, access to water and basic healthcare. This implies a rise in the region’s social capital and, presumably along with it, expectations for greater socio-economic mobility, especially among youth.
But these expectations confront rising inequality of opportunities in many social indicators. This presents us with a paradox: while social inequalities are declining, circumstances beyond the control of youth, such as family wealth, fathers’ education level and gender, are playing a more important role. We argue that the reason why these social inequalities of outcomes and opportunities are not moving in tandem might be explained by governance frameworks and economic policies.
On the economic policy front, these include outcomes such as low growth in household income, sluggish poverty reduction, a squeezed middle class and high-income inequality, findings that do not often tally with the conventional wisdom.
The main economic policy message is that these trends are driven by rentier and stabilisation-focused rather than structural transformation-oriented economic policies, which yield poor labour market and productivity outcomes with increasingly limited fiscal space for development and social expenditure.
Political economy considerations reveal the true nature of the inequality trap: an inherently political process. Barriers to labour market entry, conservative education systems, generational divides and a hegemonic patriarchal system, among others, are factors that warrant immediate attention.
As noted by ESCWA (2018), there is a notable increase in inequality of access to good quality education and to good jobs in several countries of the region, which further entrenches income inequalities. The Arab region also hosts an oversized informal labour market with the formal market restricting entries to those able to curry favours with the political elites.
In many Arab economies, there is a noticeable dominance of large firms – often headed by people with political connections – and a large number of small and micro-enterprises, along with a weak even negligible presence of middle-sized firms. Hence, the ‘missing middle’ characterises labour markets and is a direct result of restrictions on entry for ordinary citizens.
Education systems also serve to indoctrinate students and are heavily influenced by religious and conservative values that reward allegiance to authority and patriarchy and discourages innovation and creativity. This is coupled with a conservative system of social values at the family level and a generational divide characterised by a young generation with increasing aspirations for personal autonomy but with perceived low levels of control over their lives and, consequently, little power for supporting social change.
To sum up, in the region we are faced with young dreamers who desire change but feel unable to make it happen, and an older generation who can influence things but have no desire to do so (ESCWA, 2018).
What to do? In essence, Arab countries need to think beyond temporary fixes and address the root causes of endemic development challenges. Addressing such challenges depends on the achievement of two strategic objectives: capitalising on the youth bulge through structural transformation; and reforming institutions, which is also a prerequisite for structural transformation.
Good governance would allow prudent policy design that effectively targets the disadvantaged and reduces poverty and inequality, while simultaneously ensuring a competitive and thriving economy that it is able to absorb the young and capitalise human capital in the region.
Societies where individuals are autonomous and where there is political inclusion, can find solutions to improve the quality of public services and reduce the existing gaps in labour markets, enhancing equality of opportunity. This would foster political stability and feed back into enhanced human development and economic growth.
Our report offers several entry points to stimulate public policy discussions with follow-up concrete actions to these ends. The recommendations include revamped commitment to public social services and social protection for all; appropriately designed cash transfers and employment guaranteed schemes for the poor and vulnerable; and decent employment via transformational growth at the national and regional levels for the middle class.
Finally, the declining trend of (mainly oil) rents per capita since 2008 – and its projected slide due to factors such as population growth and declining oil prices – provide a strong incentive for focus on social and economic inequality in Arab countries by implementing such economic policy and institutional reforms.
Further reading
Abu-Ismail, K, and N Sarangi (2015) ‘Rethinking the Measurement of the Middle Class: Evidence from Egypt’, UNU WIDER.
CAPMAS (2019) ‘CAPMAS Chairman on the main results of the Household Income and Expenditure Survey’, Daily News Egypt, 21 October 2019.
ESCWA (2015) ‘Inequality, Autonomy and Change in the Arab Region: Social Development Report 2‘.
ESCWA (2017) ‘Rethinking Fiscal Policy In Arab Countries’.
ESCWA, UNICEF, OPHI and LAS (2017) ‘Multidimensional Poverty in Arab States’, ESCWA, United Nations Children’s Fund, Oxford Poverty and Human Development Initiative and League of Arab States.


