In a nutshell
To understand the dynamics of poverty in the absence of regular household income and expenditure surveys, analysts must exploit and extend approaches that allow them to use alternative sources of data.
Analysis of this kind in Lebanon reveals a massive increase in the proportion of poor in 2022 compared with 2018: under the most optimistic scenario, at least three out of five people in the country now live in poverty.
There is an urgent need for substantial political and economic reforms, implying a complete overhaul of the financial and political institutions of the country.
According to the World Bank (2021), the Lebanese financial and economic crisis is likely to rank among the top three most severe global crises episodes since the mid-19th century. Although this economic depression started a few months before the Covid-19 pandemic, its direct effects have been immediate. Furthermore, the port explosion in Beirut on 4 August 2020 has exacerbated these effects.
Assessing how poverty rates have evolved in Lebanon is crucial in such a context. This column documents a sharp increase in Lebanon’s absolute poverty starting in 2019. This increase in poverty levels is observed despite a short-lived lull in 2018 arising from electoral spending, which artificially alleviated poverty.
Poverty analysis usually requires regular surveys of household consumption or income, which have been unavailable in Lebanon in recent times. In such a context, one should explore alternative approaches to produce the evidence essential for designing policies for economic recovery.
One option is to use models to ‘nowcast’ poverty. For example, Abu-Ismail and Hlásny (2020) used this approach to offer a first look at the evolution of poverty in the country. Their results suggest that the proportion of the population with earnings below the poverty line in 2020 is at least 27.3% under an optimistic scenario. But their analysis indicates that it could be as high as 55.3% under more realistic assumptions.
Another option would be to follow the path suggested by Atamanov et al (2020) to find and use alternative sources of statistical data. In our work, we explore this latter path and complement Abu-Ismail and Hlásny’s (2020) work by proposing an additional tool for assessing the impacts of the economic depression on the daily lives of citizens in Lebanon.
This column builds on our work on measuring poverty in Lebanon over the past couple of years using unconventional methods (see Makdissi et al, 2023). The approach is rooted in the widespread issue of data poverty in the Middle East and North Africa in general and the recent economic history of Lebanon in particular.
Use of non-traditional techniques to measure poverty
The Arab Barometer Survey is currently the only widely available data source that provides the necessary information to estimate poverty indices in the context of Lebanon. But it presents two critical challenges:
- First, in the 2016 and 2018 waves, the income data are elicited as intervals.
- Second, there is a non-negligible number of non-responses: 5.9% of the 1,500 observations in 2016, 3.0% of the 2,400 observations in 2018, and 15.1% of the 2,399 observations in 2021-22.
We exploit and expand existing data augmentation techniques to overcome the first challenge of constructing the continuous cumulative income distribution. In doing so, we exploit all the available interval information on income – that is, the information on income in the first two waves (in the third wave, the income variable is continuous).
To address the second issue arising from non-response in the survey, we estimate a lower bound and an upper bound for poverty measures and on the sets of admissible cumulative distribution functions of income. These sets of admissible cumulative distribution functions will cover all possible distributions under all possible assumptions on the mechanism underlying non-response to the income question in the survey.
Evidence on poverty
Given the Lebanese economic context and the lack of household income and expenditure surveys, we exploit and extend data augmentation tools to develop a better understanding of poverty dynamics and the situation preceding the economic collapse (that is, before the 2019 uprisings) to the present.
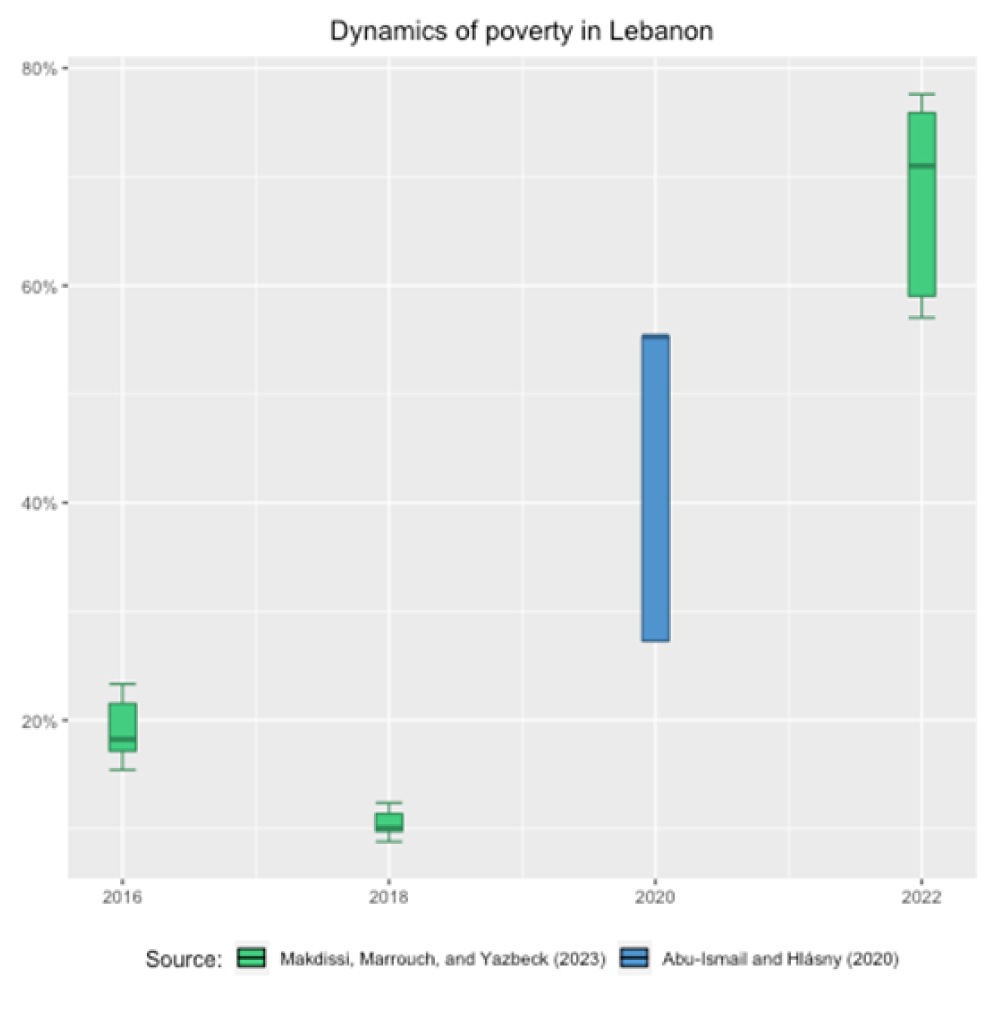
Figure 1 displays the incidence of poverty for 2016, 2018, 2020 and 2022. For 2020, we use the nowcasted values produced by Abu-Ismail and Hlásny (2020), and for the three remaining years, we use the values in Makdissi et al (2023). The y-axis represents the proportion of the poor.
The colour bar displays all potential values obtained under different assumptions. The blue bar displays the values that Abu-Ismail and Hlásny (2020) produced under different growth incidence assumptions in their nowcasting model. The green bars display all potential values that Makdissi et al (2023) get using alternative assumptions to explain missing values. Finally, the error bar gives the 95% confidence interval on the bounds of these sets of values.
Figure 1: Dynamics of poverty in Lebanon

Suppose one uses the upper-middle-income country poverty line to estimate the proportion of poor in Lebanon and assumes ‘missingness-at-random’ (the standard assumption in this body of research). In the figure, these values are represented by the darker bar within each of the boxes. In this case, the proportion of poor out of total population for 2016 is 18.2%; it falls to 10.0% in 2018, then increases to 55.3% in 2020, and to 71.0% in 2021-22.
Since there is a considerable proportion of non-responses in 2021-22, we account for these non-responses and estimate the bounds on the set of admissible poverty headcounts. The proportion of poor in 2016 is between 17.2% and 21.5%; it decreases to values between 9.8% and 11.4% in 2018 and then increases to values between 59.0% and 75.9% in 2021-22.
These figures suggest that the country-level Ponzi scheme, which was initiated in the run-up to the 2018 general elections, allowed for an artificial poverty reduction between 2016 and 2018. To assess the robustness of these results, we run stochastic dominance tests (see Makdissi et al, 2023) and conclude that this result is valid for any poverty index, poverty line, and assumption made on non-responses observed for the income question.
The stochastic dominance tests also indicate that the economic collapse, which started in 2019, increased poverty in 2021-22 to higher levels than in 2018 and 2016. This conclusion is valid for any poverty index and any poverty line the analyst may choose.
If one wants to account for the considerable increase in non-response to the income question in the 2021-22 wave (15.1% of non-responses), it is still possible to say that poverty is higher in 2021-22 than in 2018 and 2016. But one should restrict the poverty lines to any values of household income between 0 and 1,500,000 of 2018 LBP /month (that is, US$995 /month).
Policy implications
The policy implications of the results presented in this column cannot be more evident. Suppose one assumes that all 15.1% of non-responses to the income question in the 2021-22 survey wave all have an income level equal to the highest income in the data set; the proportion of poor in the country will still be 59%, even under this extremely favourable assumption. Using the standard missing-at-random assumption increases this proportion to 71%.
Having at least three poor people out of every five residents of Lebanon is a clear signal of the emergency of the situation. Immediate substantial political and economic reforms, implying a complete overhaul of the financial and political institutions of the country, are the only path toward economic recovery.
Further reading
Abu-Ismail, K, and V Hlásny (2020) ‘Wealth distribution and poverty impact of COVID-19 in Lebanon’, ESCWA Technical Paper 8.
Atamanov, A, SA Tandon, GC Lopez-Acevedo and MA Vergara Bahena (2020) ‘Measuring monetary poverty in the Middle East and North Africa (MENA) region: Data gaps and different options to address them’, World Bank Policy Research Working Paper Series 9259.
Makdissi, P, W Marrouch and M Yazbeck (2023) ‘Monitoring poverty in a data deprived environment: The case of Lebanon’, Working Paper 2302, Department of Economics, University of Ottawa.
World Bank (2021) ‘Lebanon sinking (to the top 3)’, Lebanon Economic Monitor, Spring 2021.


