
In a nutshell
More than three-quarters of Algeria’s population are deprived of at least one of the following assets: water heater or cumulus, oil bath and heating, television and refrigerator, no internet and means of access to information.
Given the high levels of deprivation on this measures, policy-makers should invest in infrastructures, facilitate access to equipment and information by developing the banking system and allowing people with liquidity constraints to have loans for consumption, particularly on local products.
Policy-makers should also invest more in quality education; rethink social protection programmes to target the poor more effectively; and focus on people in rural areas, young people and informal workers who have no social security coverage.
Poverty is a global challenge, particularly extreme poverty, which increased in 2020 for the first time in over 20 years. Depending on the degree of economic severity considered, the World Bank estimates that the pandemic could push an additional 88 to 115 million people into extreme poverty in 2020, with the total rising to as many as 150 million by 2021.
Given the importance of the issue and although data on money metric poverty are not available, this column considers multidimensional poverty in Algeria. To do so, we analyse data from the MICS survey (2019), which offers a unique opportunity to update what we know about poverty in Algeria.
We estimate multidimensional poverty using five dimensions of poverty: education; health; living conditions; employment; and financial inclusion. Each dimension is made up of indicators reflecting the level of household and individual access to certain basic necessities. Based on these indicators, we build a ‘multidimensional poverty index’ (MPI) estimating the percentage of the population deprived from a minimum (poverty line) required for a life of dignity.
More specifically, the individual or household is classified as poor if he or she does not have access to more than 33% (50%) of the basic necessities included here. The results show that the poverty rate is 14.6% (2%) but there are considerable differences by region and by socio-demographic variables.
Based on these results, we highlight targeting errors (exclusion and inclusion errors) in social assistance programmes and propose recommendations for social policies to reduce poverty and thus achieve the first objective of sustainable development.
The methodology relies on the Alkire-Foster method, which is recognised and applied by many international institutions (UNDP, 2020; UNESCWA, 2018). This method consists of two main steps: the first identifies the poor using a dual cut-off approach and counting different deprivations that a person or household experiences.
The second step relies on a number of deprivations to estimate the headcount ratio/ poverty rate. This can be analysed with regard to different socio-demographic aggregates such as age, gender and region.
The indicators that have been chosen here are in line with the Sustainable Development Goals (SDGs) and are derived from the latest MICS survey undertaken by UNICEF and MSPRH with 29,919 households (more than 147,000 individuals) in 2019. Figure 1 summarises the indicators that have been used to calculate multidimensional poverty.
Figure 1: Structure of global multidimensional poverty
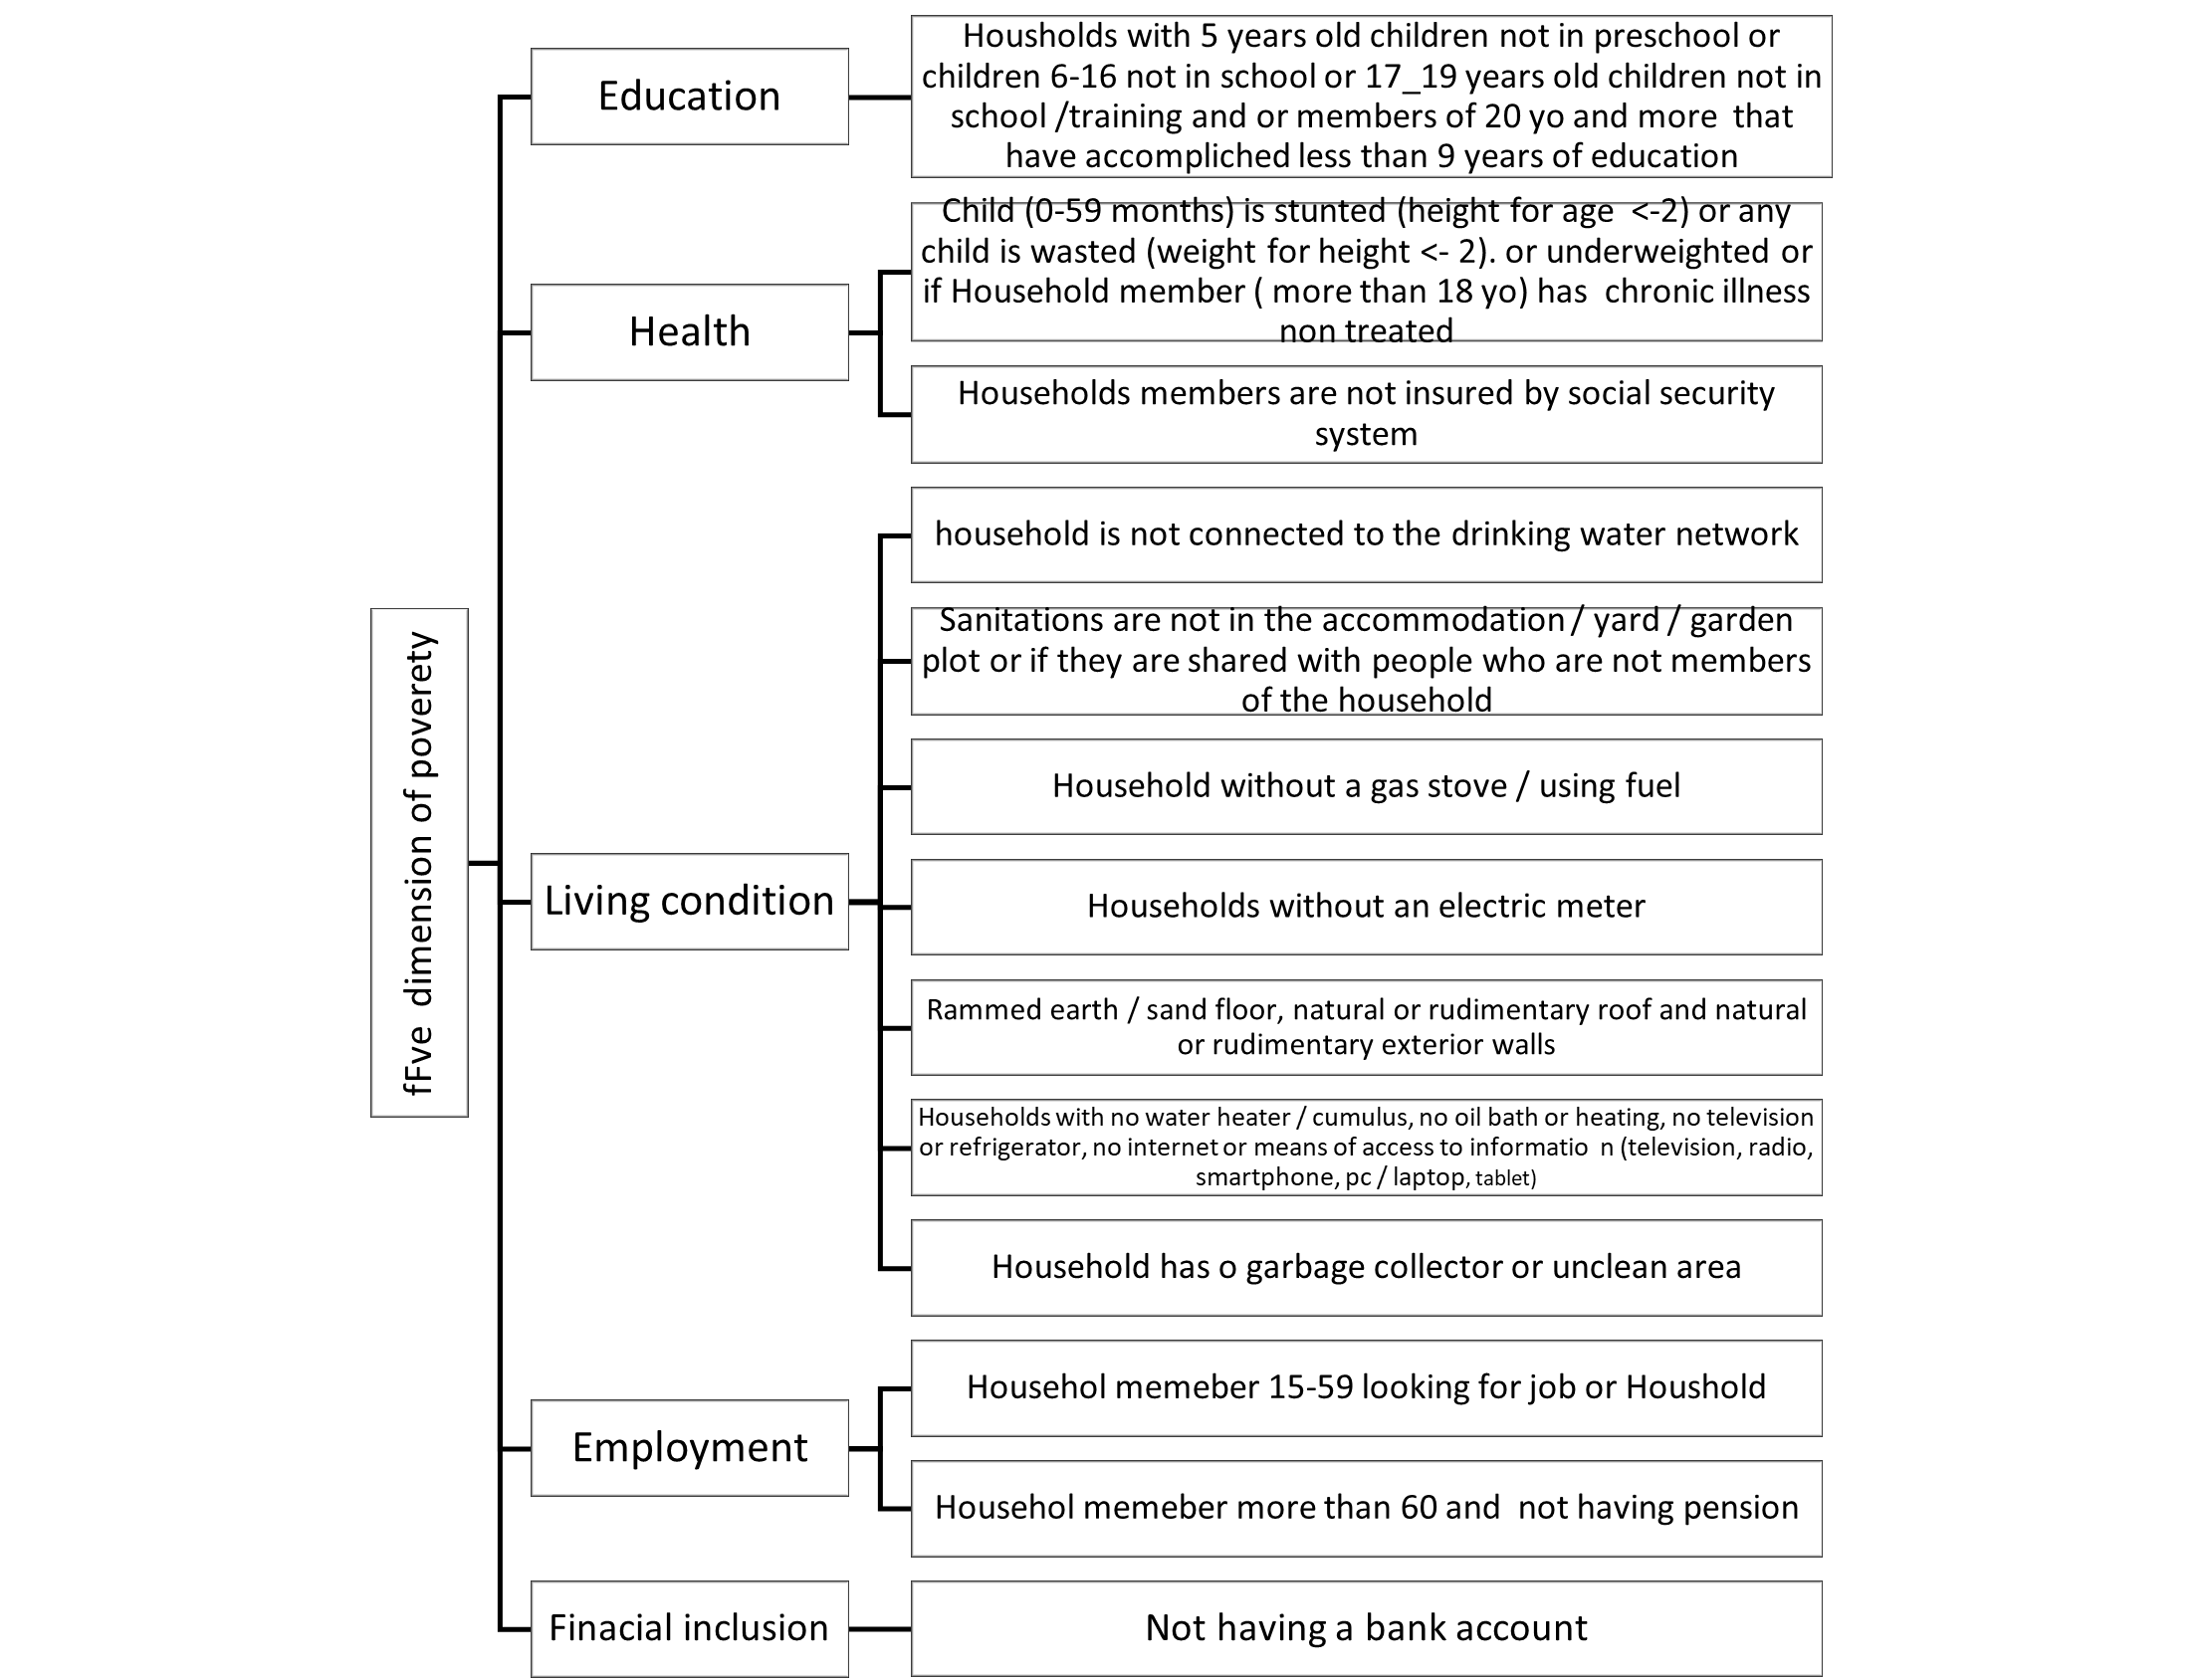
Source: Authors.
Figure 1 shows the 13 indicators used to estimate multidimensional poverty; the second column shows the five dimensions of poverty: education, health, living conditions, employment and financial inclusion (further work will add person per room and life satisfaction measures); and the third column provides a definition of a poor household for each of the 13 indicators.
While previous research tends to apply the same methodology across countries, we believe that this may not be very efficient for policy-making; indeed, each country has its own social strategy, objectives and fiscal space.
We argue that there is no universal MPI and each country has to be encouraged to estimate its own MPI using their prioritised indicators. Hence, the indicators used here have been chosen according to the Algerian strategy of social development.
For example, Algerian law provides for free and mandatory education for nine years; the country’s health law assumes that healthcare is universal and free for all citizens; and the social protection system is supposed to leave no one behind. But the empirical analysis shows that those objectives as still not achieved – see Figure 2.
Figure 2:
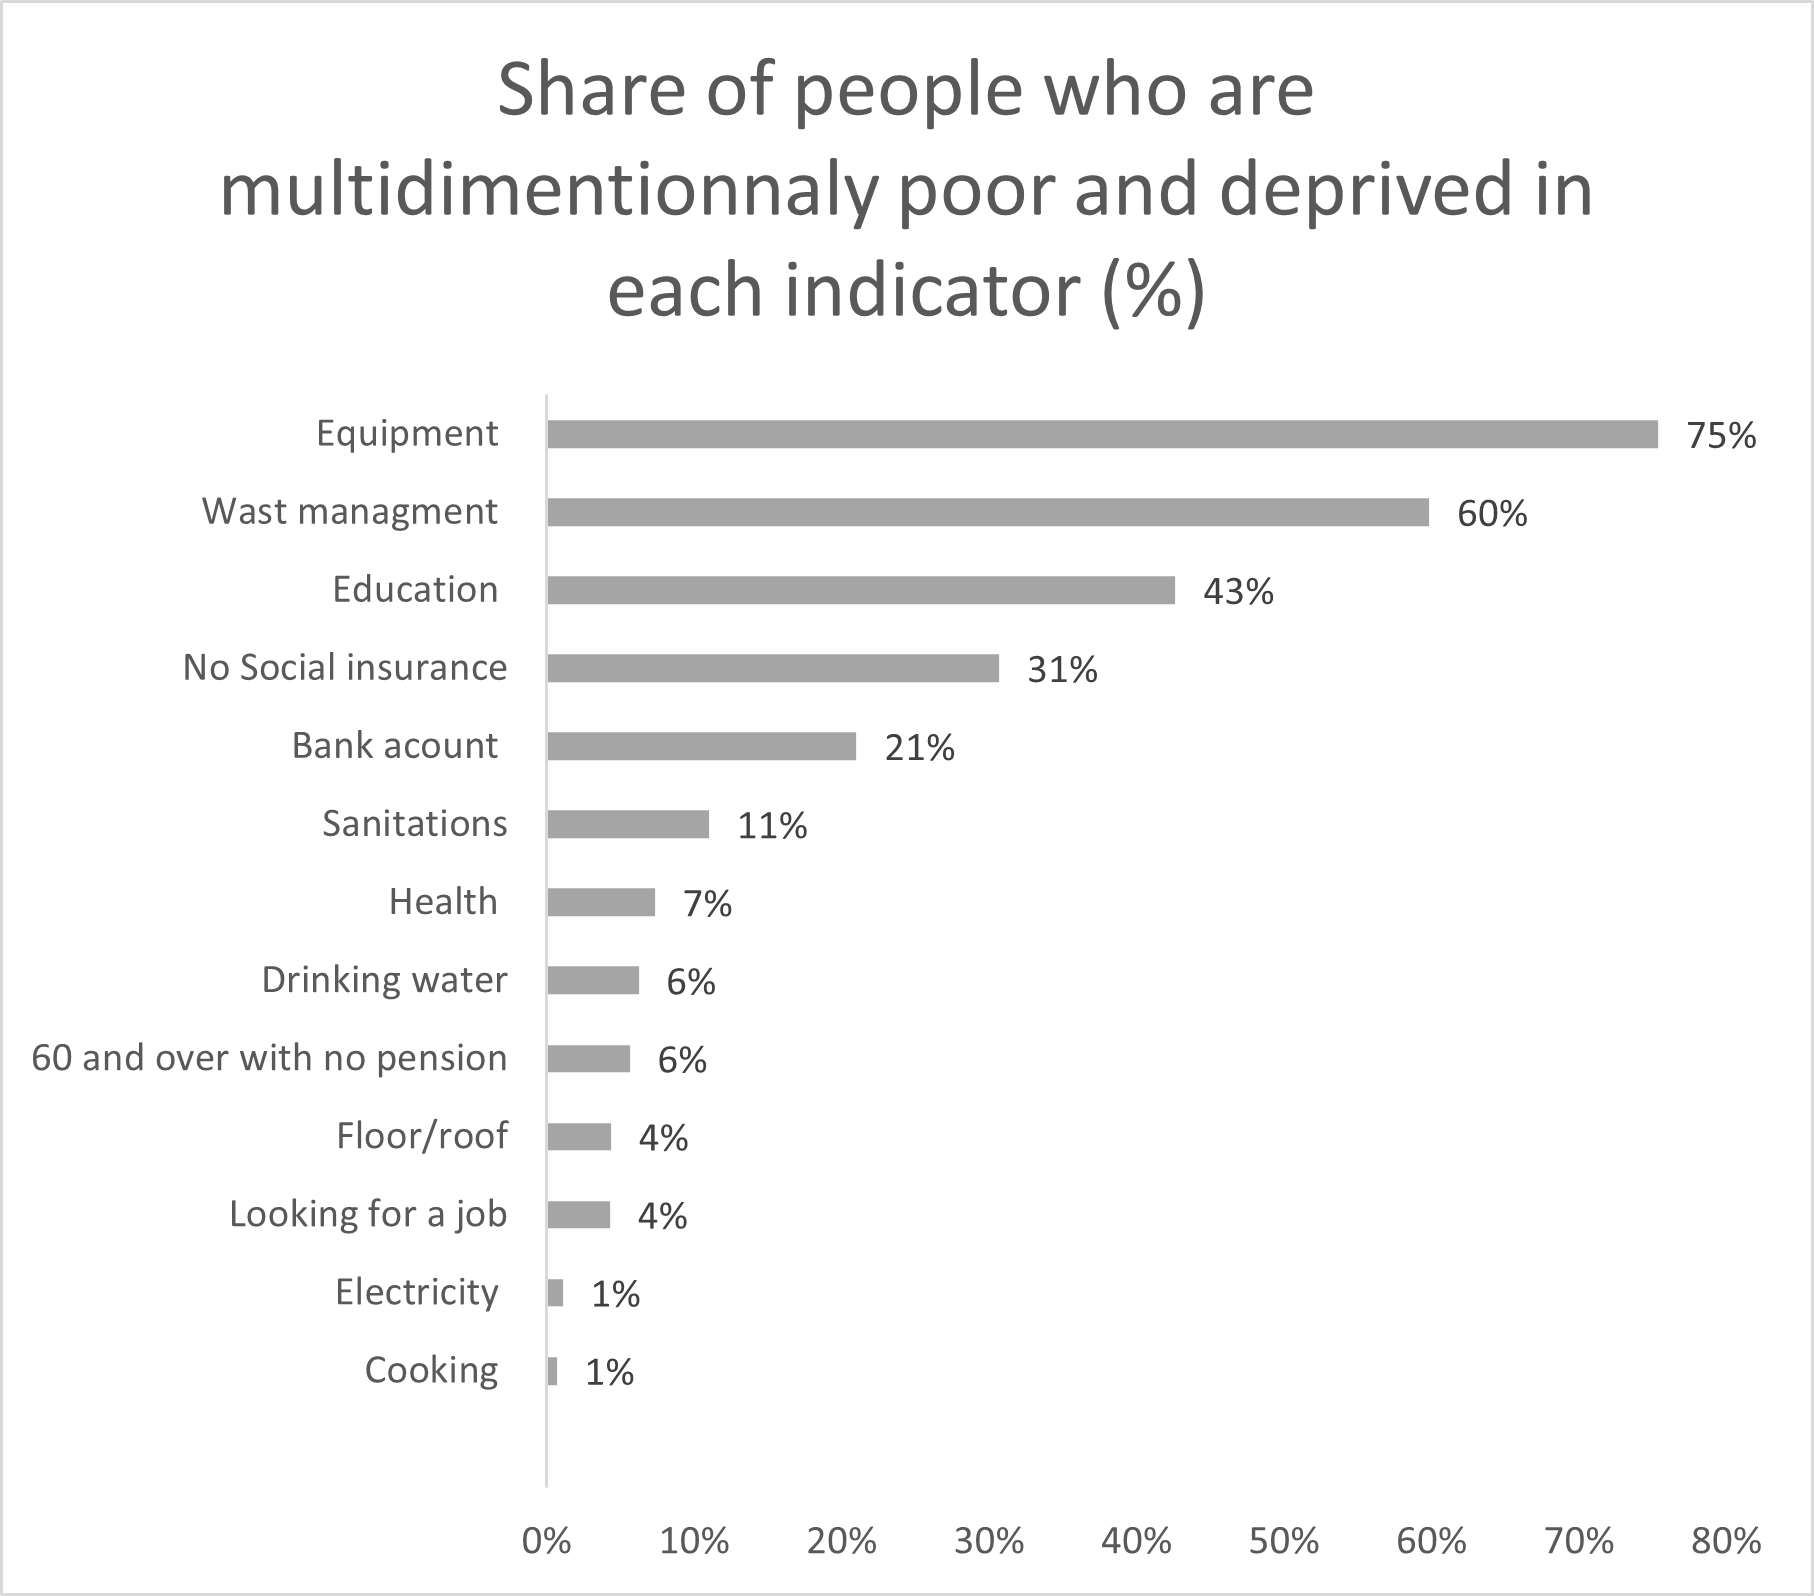
Source: Authors relying on MICS survey 2019.
Figure 2 presents the results of deprivation before identifying the poor and shows that the indicator with the highest headcount is equipment and information; more than 75% of the population are deprived of at least one of the following assets: water heater or cumulus, oil bath and heating, television and refrigerator, no internet and means of access to information (television, radio, smartphone, pc/laptop, tablet).
Waste management and education are the next two indicators for deriving multidimensional poverty. Around 60% of the population seems to have no access to waste management and the area where they live is not clean. Further, 43% of households have at least one children of 5 years old not in the pre-school system, or 6-16 year old not at school, or 17-20 year old not at school or in training or a person with more that 20 years but did not accomplish nine years of schooling.
For other measures, 31% have no social security coverage and more than 20% have no bank account, which makes them more likely to be financially excluded. Sanitation, health and drinking water are still significant indicators of deprivation with 11%, 7% and 6% of households, respectively, missing access to those necessities. The remaining indicators seem to show low headcount ratio.
Moving to the main focus of our study, which identifies multidimensionally poor individuals. An individual is classified as poor if they have more than four deprivations (poverty cut-off) out of 13. The poverty rate is estimated is 14,6%. This poverty rate is equal to 2% if we increase the poverty cut off to seven deprivations instead of four.
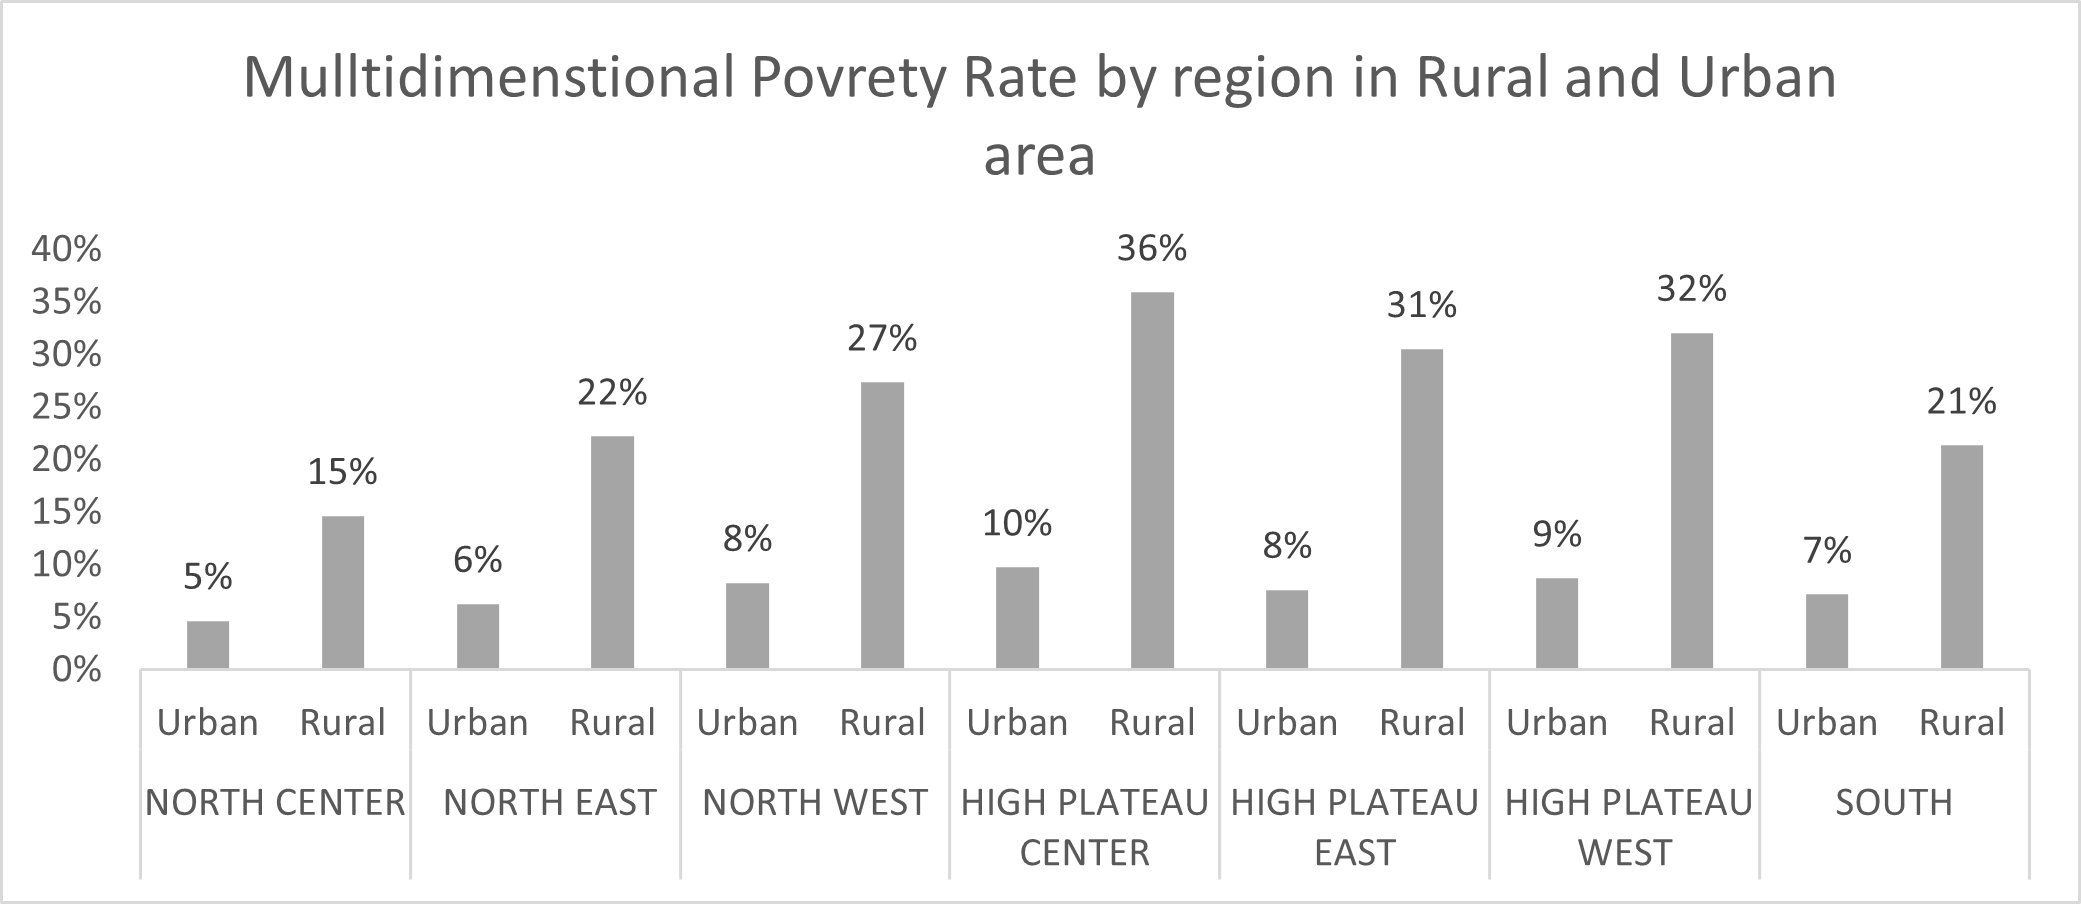
The analysis of this multidimensional poverty headcount by socio-demographic variables shows differences by age, gender, education and region. First, multidimensional poverty is higher in rural areas compared with urban areas. Figure 3 shows that for all regions in Algeria, rural areas are clearly left behind compared with urban areas.
Source: authors relying on MICS survey 2019.
Figure 3 shows that across the seven regions, rural areas are highly deprived compared with urban areas. The highest difference is observed in the three regions of the high plateau. Hence, policy-makers need to pay special attentions to those regions when implementing social policies.
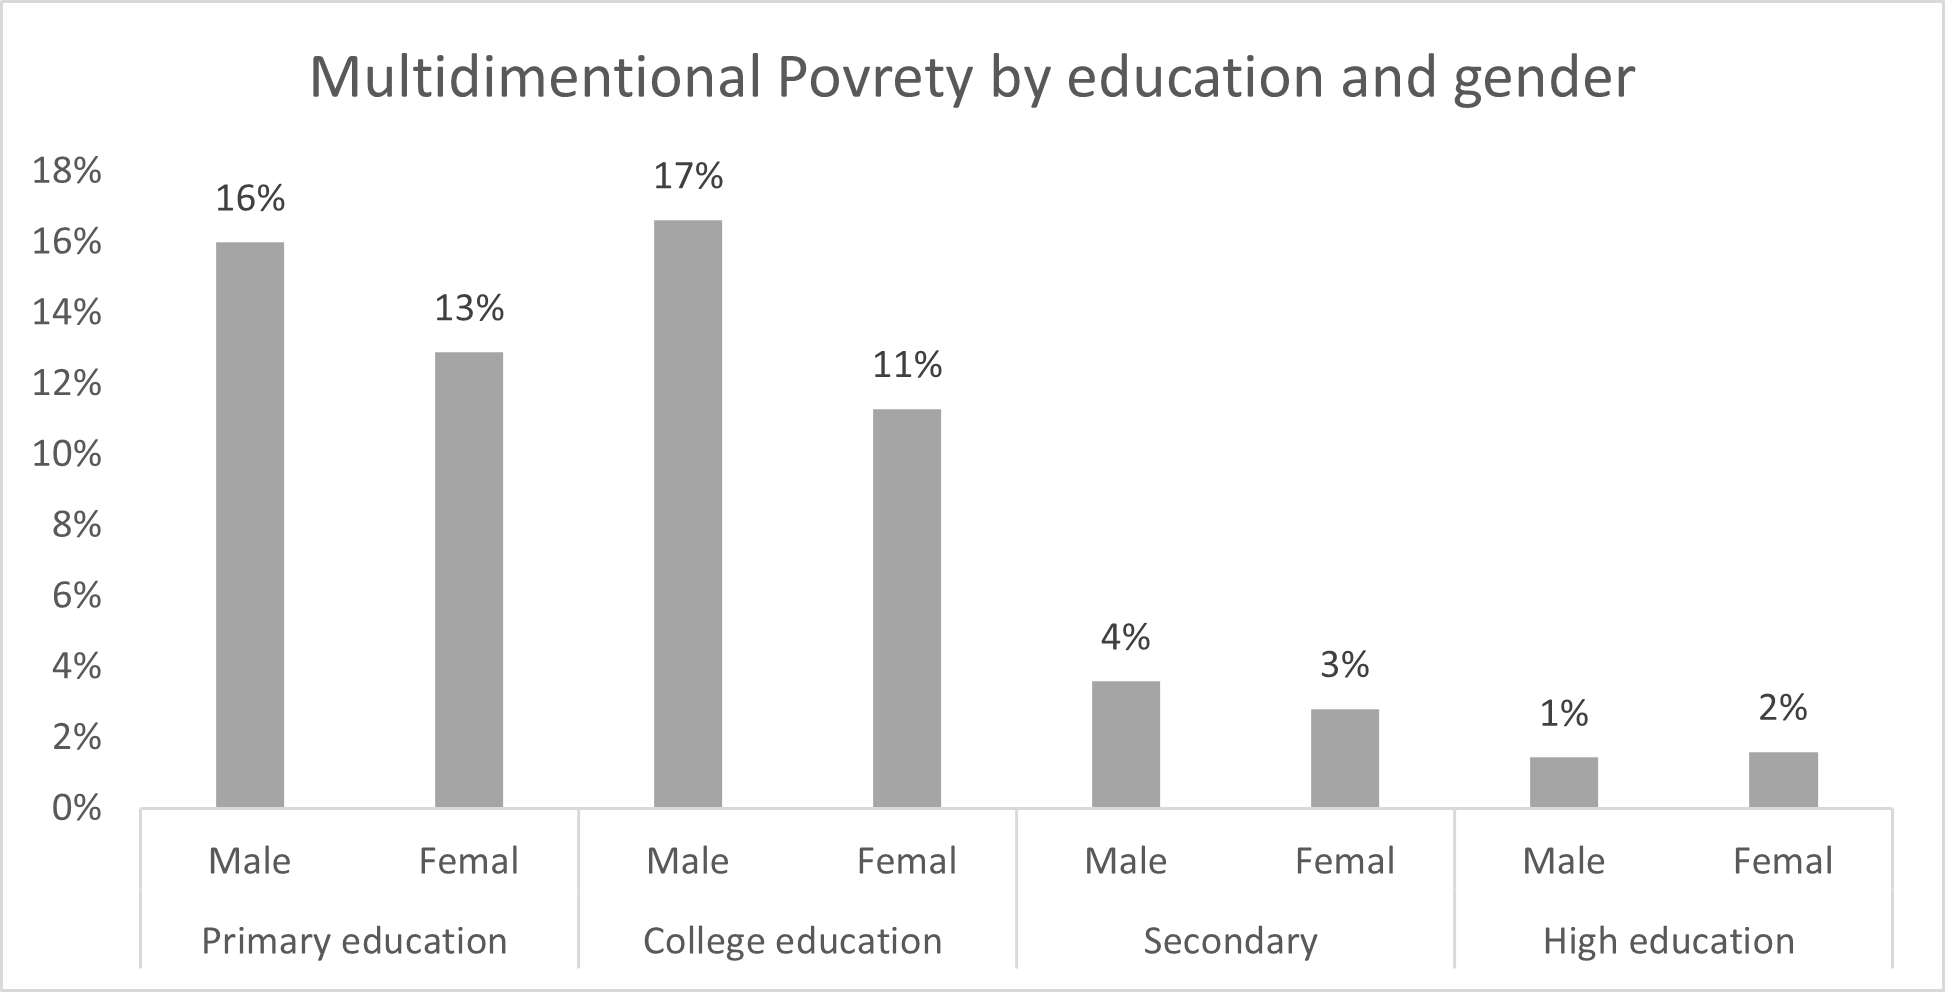
Multidimensional poverty is higher for people with low levels of education. The survey shows that the poverty rate is 14% for people with primary and college education. The poverty rate is clearly lower for people with higher levels of education (3.22%) and university education (1.52%). The gender analysis shows that men (15%) are more likely to fall below the poverty line compared with women (13%). But the gender gap seems to decrease with education – see Figure 4.
Source: authors relying on MICS survey 2019.
Figure 4 shows that gender inequality is higher for people with low levels of education: this inequality seems to decrease with level of education. Hence, the government needs to invest in quality education and training to reduce poverty and inequality.
To make our results more robust, we run a binary logistic regression on the ‘Poor’ variable (which is a dummy equal to 1 if the individual is poor), with regard to a set of socio-demographic variables. The results confirm the descriptive statistics and show that young people (15-29) are 3.02 times more likely to be poor, and women are 1.35 less likely to be poor compared with men.
The results also show that people with secondary level of education and high/university level of education are 7.69 and 16.66 less likely to be poor compared with people with low levels of education. The special analysis shows a big difference between urban and rural areas; people living in rural areas are 3.64 more likely to be poor. People living in the high plateau – centre (2.10), east (2.18) and west (3.17) – are more likely to be poor compared to the centre north (reference variable).
Last but not least, the analysis shows that people who received at least one social housing support from government are 1.35 less likely to be poor, while people who received at least one social transfer/assistance are 1.1 more likely to be poor. This result could be interpreted in two ways: the first supposes that social assistance is going to the poor and the targeting mechanism is quite efficient.
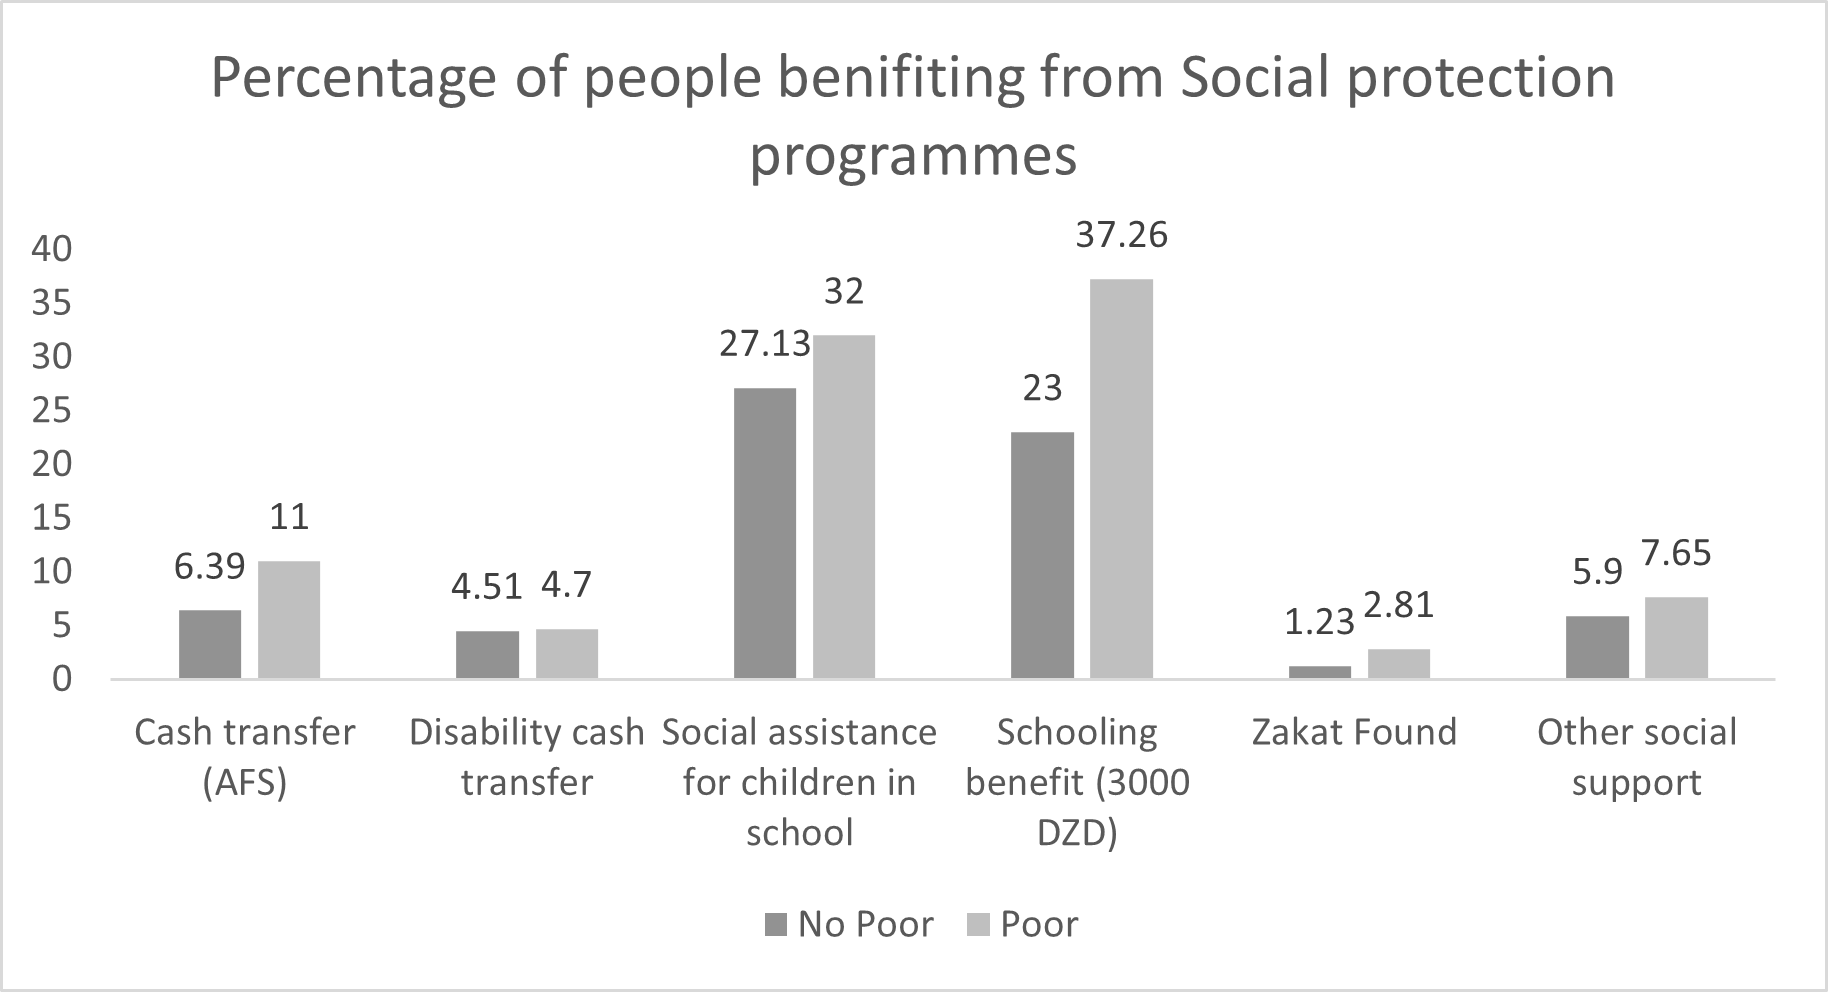
The second would claim that social assistance programmes are not efficient and have not reached their objectives of shifting people out of poverty. We support the second interpretation given that the targeting analysis shows that there is some inclusion and exclusion errors in social assistance programmes – see Figure 5,
Source: authors relying on MICS survey 2019.
Figure 5 highlights some exclusion and inclusion errors in social protection programmes. The exclusion errors can be seen in the low coverage of the poor population through the different programs and the inclusion errors could be seen through the coverage of some non-poor people by different programmes.
To conclude, this exercise is a first attempt to update multidimensional poverty in Algeria and many points need to be developed further such as the inclusion of other indicators in the estimation of multidimensional poverty and the estimation of other output such as the intensity of poverty and poverty gap. Nevertheless, some policy recommendations can be derived from this study:
First, given the high deprivation for equipment and information, policy-makers should facilitate access to equipment and information by developing the banking system and allowing people with liquidity constraints to have loans for consumption, particularly for consumption of local products to avoid negative economic impact and combine economic development with social development.
- Second, policy-makers should rethink social protection programmes to target the poor more effectively.
- Third, they should invest more in quality education.
- Fourth, social policy programmes need to pay more attention to people in rural areas and the high plateau, young people, and informal workers who have no social security coverage.
- Last but not least, it is worth noticing the challenges of the vast surface area and relief of Algeria. Hence, policy-makers need to find additional fiscal space to invest in social infrastructure covering all the Algerian territories.